Troubleshooting
Connection issues
Data/Forwarder node status shown in gray in the web console
First, check whether the Control Node can reach the web server of the Data/Forwarder node. Sign in to the Logpresso shell on the Control Node, and then enter the IP address of the Data/Forwarder node and the web server port as shown below to check connectivity.
# tcpscan <Data/Forwarder node IP> 8443
tcpscan 203.0.113.161 8443
Diagnosing firewall policy issues
Depending on the command output, there may be a firewall policy issue or a federation communication port issue as described below.
- timeout
-
If
timeoutis displayed after a certain amount of time when you run the tcpscan command, check every firewall policy on the communication path from the Control Node to the Data/Forwarder node, along with the node's local firewall policy using thefirewall-cmd --list-allcommand.trying to connect /203.0.113.161:8443 timeout - not opened: Connection refused
-
If the
not opened: Connection refusedmessage is displayed, the federation communication port is not open. Run thehttpd.bindingscommand in the Logpresso shell on the Data/Forwarder node to recheck the port settings. When it is working properly, the output looks like the following.# httpd.bindings command output /0.0.0.0:8443 (ssl: key logpresso-web, trust null), opened, default context: webconsole, idle timeout: 0seconds, log file prefix: null, access log: false, error log: false -
Run the
httpd.openSslcommand as shown below to open the federation communication port.# httpd.openSsl <port> <context> <key alias> httpd.openSsl 8443 webconsole logpresso-web
Diagnosing web server certificate issues
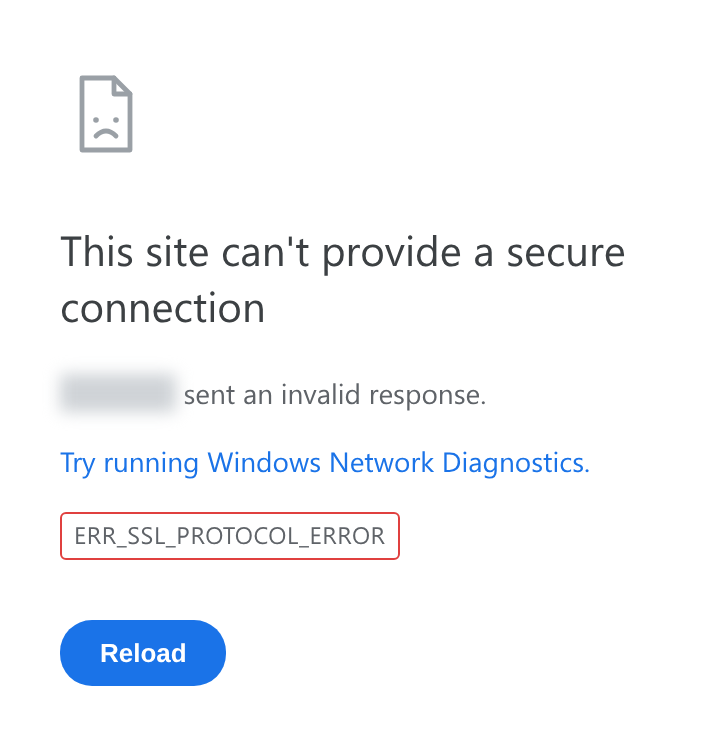
If the tcpscan <Data/Forwarder node IP> 8443 command shows opened but the Data/Forwarder node connection status is still shown in gray in the web console, the SSL certificate or the policy synchronization password is set incorrectly. To determine the cause, connect to port 8443 of the node from a web browser on your operations terminal. If ERR_SSL_PROTOCOL_ERROR is displayed as shown below, it is a certificate issue.
If it is a web server certificate issue on the Data/Forwarder node, run the master node connection setup again with the sonar.setMaster command (this goes through the process of downloading and installing the certificate while communicating with the master node). The following describes the values to enter when you run the sonar.setMaster command.
host? 203.0.113.193    # Virtual IP address of the Control Node pair
port? 8443             # Enter 8443
account? root          # Enter the Control Node federation account root
password?              # Enter the password of the Control Node federation account
connect timeout? 10000 # Press Enter to use the default value
read timeout? 10000    # Press Enter to use the default value
secure? true           # Enter true (the default is false)
skip cert check? true  # Enter true (the default is false)
Diagnosing policy synchronization password issues
If the ENT web console screen is displayed properly when you connect to port 8443 of the Data/Forwarder node from a web browser, enter the federation account name and password on this screen to check whether you can sign in successfully. If you cannot sign in, run the dom.resetPassword localhost root command in the Logpresso shell on the Data/Forwarder node to reset the password, and then re-enter the reset password in the Password fields under Node A Settings and Node B Settings on the System > Clusters > Node screen of the web console.
Failure to connect from a Data/Forwarder node to the Control Node RPC
Diagnosing the RPC connection status
Run the following commands in the Logpresso shell on the Data/Forwarder node to check whether the connection to the Control Node RPC port works.
forwarder.connections # For a Forwarder node
sentry.connections    # For a Data node. Can also be run on a Forwarder node
The command output should list content like the following.
Connections
--------------------
[c1a] id=1317075310, peer=(39c2dd55-5bb5-4497-a327-ee6f8cae9ad9, /203.0.113.194:7140), trusted level=Low, ssl=true, props={phase=post_hello, ping_failure=0, type=command}
If no RPC connection related to the Control Node IP address is listed as shown above, it may be a firewall policy issue or an issue with the certificate used for TLS mutual authentication.
Diagnosing firewall policy issues
First, in the Logpresso shell on the Data/Forwarder node, enter the Control Node IP address and RPC port as shown below to check connectivity.
# tcpscan <Control Node IP> 7140
tcpscan 203.0.113.193 7140
If timeout is printed after a certain amount of time as shown below, check every firewall policy on the communication path from the Data/Forwarder node to the Control Node.
trying to connect /203.0.113.193:7140
timeout
Diagnosing SSL certificate issues
In the Logpresso shell on the Data/Forwarder node, run the logger.tail command or view the /opt/logpresso/log/araqne.log file to check the daemon log.
Certificate password error
If a keystore password was incorrect error occurs as shown below, the certificate password is incorrect.
[2025-01-30 09:24:10.812]  WARN (KeyStoreManagerImpl) - getKeyStore() error:
java.io.IOException: keystore password was incorrect
        at java.base/sun.security.pkcs12.PKCS12KeyStore.engineLoad(PKCS12KeyStore.java:2116)
        at java.base/sun.security.util.KeyStoreDelegator.engineLoad(KeyStoreDelegator.java:222)
        at java.base/java.security.KeyStore.load(KeyStore.java:1479)
        at org.araqne.keystore.KeyStoreManagerImpl.getKeyStore(KeyStoreManagerImpl.java:298)
        at org.araqne.keystore.KeyStoreManagerImpl.getKeyManagerFactory(KeyStoreManagerImpl.java:414)
        at org.araqne.rpc.RpcKeyStoreManagerImpl.__M_getKeyManagerFactory(RpcKeyStoreManagerImpl.java:62)
        at org.araqne.rpc.RpcKeyStoreManagerImpl.getKeyManagerFactory(RpcKeyStoreManagerImpl.java)
        at org.logpresso.sentry.impl.ConnectionWatchdogImpl.__M_connect(ConnectionWatchdogImpl.java:216)
        at org.logpresso.sentry.impl.ConnectionWatchdogImpl.connect(ConnectionWatchdogImpl.java)
        at org.logpresso.sentry.impl.ConnectionWatchdogImpl.__M_checkConnections(ConnectionWatchdogImpl.java:171)
        at org.logpresso.sentry.impl.ConnectionWatchdogImpl.checkConnections(ConnectionWatchdogImpl.java)
        at org.logpresso.sentry.impl.ConnectionWatchdogImpl.__M_checkNow(ConnectionWatchdogImpl.java:149)
        at org.logpresso.sentry.impl.ConnectionWatchdogImpl.checkNow(ConnectionWatchdogImpl.java)
        at org.logpresso.sentry.impl.ConnectionWatchdogImpl.__M_run(ConnectionWatchdogImpl.java:123)
        at org.logpresso.sentry.impl.ConnectionWatchdogImpl.run(ConnectionWatchdogImpl.java)
        at java.base/java.lang.Thread.run(Thread.java:829)
Caused by: java.security.UnrecoverableKeyException: failed to decrypt safe contents entry: javax.crypto.BadPaddingException: Given final block not properly padded. Such issues can arise if a bad key is used during decryption.
        ... 16 more
Untrusted certificate error
If a No trusted certificate found error occurs as shown below, the certificate used is not the one issued by the Control Node but the one automatically generated when the daemon first started.
[2025-01-30 09:28:14.623] ERROR (ConnectionWatchdogImpl) - logpresso-sentry: failed to connect, closing connection (No trusted certificate found)
[2025-01-30 09:28:14.624] ERROR (RpcHandler) - araqne rpc: ssl handshake exception from x.x.x.x:7140, channel 2ca2e90a (No trusted certificate found)
For both errors, run the master node connection setup again with the sonar.setMaster command (this goes through the process of downloading and installing the certificate while communicating with the master node). The following describes the values to enter when you run the sonar.setMaster command.
host? 203.0.113.193    # Virtual IP address of the Control Node pair
port? 8443             # Enter 8443
account? root          # Enter the Control Node federation account root
password?              # Enter the password of the Control Node federation account
connect timeout? 10000 # Press Enter to use the default value
read timeout? 10000    # Press Enter to use the default value
secure? true           # Enter true (the default is false)
skip cert check? true  # Enter true (the default is false)
Diagnosing Syslog reception
If Syslog is not collected properly through a Forwarder node even after you configure a collector in the web console, diagnose the issue as described below. The following example assumes that packets are sent from the IP address 172.20.100.100.
Forwarder node trace
-
Connect to the Forwarder node over SSH, and then run the following command to enter the Logpresso shell.
ssh -p7022 root@localhost -
Run the
syslog.serverscommand to list the Syslog server settings.Syslog Servers ---------------- [logpresso] 0.0.0.0:514 (udp), charset=UTF-8 (override: 0), capacity=20000, rx_buf_size=0, receiver_cpu_id=-1, queue_count=1, buffer_file_path=./, buffer_file_size=10737418240, start from=2024-12-11 13:22:13, received=7 -
Use the
syslog.stats logpressocommand to view reception statistics by Syslog client IP address.Syslog Statistics ------------------- x.x.x.x => 1 (first seen 2025-01-20 10:58:44, last seen 2025-01-20 10:58:44) -
Use the
syslog.trace logpressocommand to trace the content of incoming Syslog packets in real time. PressCtrl+Cduring the trace to stop it.
Checking Syslog packets
You can verify whether packets reach the Logpresso Forwarder node by using the tcpdump command in the terminal as shown below.
# tcpdump -i <interface> host <Forwarder node IP address> port <Forwarder node syslog port> -A
tcpdump -i any host 172.20.100.100 port 514 -A
Checking whether the port is open
-
Once you confirm that Syslog packets are reaching the Forwarder node, run the
netstat -na | grep :514command to check whether the port is open.# netstat -na | grep :514 udp 0 0 0.0.0.0:514 0.0.0.0:* -
If the port is not open as shown above, you may have skipped the JVM permission granting step during installation and failed to open the port, or the port settings may have changed. Run the following command to check whether
cap_net_bind_serviceis printed.# getcap <java executable path> getcap /opt/logpresso/jdk/bin/java -
If the permission is not granted, use the
setcapcommand to grant the required permissions to thejavaexecutable.# setcap cap_net_bind_service,cap_sys_time,cap_net_raw=+ep <java executable path> setcap cap_net_bind_service,cap_sys_time,cap_net_raw=+ep /opt/logpresso/jdk/bin/java
Checking the host firewall policy
If there is no blocked segment on the connection path from the Syslog client to the Forwarder node, but Syslog packets do not reach the Forwarder node at all, run the firewall-cmd --list-ports command to recheck the host firewall policy.
# firewall-cmd --list-ports
Checking the rp_filter setting
If the firewall policy and the port open status are all normal but you cannot confirm reception with the syslog.trace command in the Logpresso shell, the issue may be with the Linux kernel's Reverse Path Filtering setting.
The Linux kernel's Reverse Path Filtering feature checks the source of a packet to block spoofed packets. The default is 1, which drops packets that come in on an invalid path.
If the Forwarder node has multiple network interface cards and packets from a source can be received through multiple network interface cards, change the rp_filter setting.
Checking the current setting
-
Run the
cat /proc/sys/net/ipv4/conf/<interface>/rp_filtercommand to check therp_filtersetting value.# cat /proc/sys/net/ipv4/conf/eth2/rp_filter # command output 10(disabled): Does not perform Reverse Path Filtering1(default, strict): Checks the path of the interface based on the packet's source IP address, and drops the packet if it does not match2(loose): Allows a packet with the same source IP address if it has a valid path through any interface
-
If the value is 1, add the following setting to the end of the
/etc/sysctl.conffile.
net.ipv4.conf.eth2.rp_filter = 2
-
Run the following command with administrator privileges to apply the kernel setting.
sysctl -p
MariaDB
Galera Cluster cannot be restarted
If you stop all Galera Cluster servers and then restart them, but the cluster does not start and the database does not start even with the systemctl start mariadb command, restart MariaDB in the following order.
-
(Control Node A) Edit the
/var/lib/mysql/grastate.datfile with administrator privileges.# GALERA saved state Version: 2.1 Uuid: 5022f7e5-281a-11e8-98c9-9baa762d13e6 Seqno: -1 Safe_to_bootstrap: 1- Change the
Safe_to_bootstrapvalue from1to0.
- Change the
-
(Control Node A) Restart the Galera Cluster server.
sudo galera_new_cluster -
(Control Node B) Run the following command to start MariaDB, and check whether
wsrep_start_positionhas the same value as Control Node A.sudo systemctl start mariadb && \ ps -ef | grep mysqlRunning this command produces a result similar to the following.
mysql 1141195 1 1 Apr15 ? 22:50:53 /usr/sbin/mariadbd --wsrep_start_position=c6609d0e-091a-11f0-86bb-3e7cc9ee21e7:40512CautionNode B joins an already-started Galera Cluster, so you must not run the galera_new_cluster command. The galera_new_cluster command must be run only on the first node to start in the cluster.
NoteIf the wsrep_start_position value is "00000000-0000-0000-0000-000000000000", run the systemctl restart mariadb command.
Diagnosing OOM and memory leaks
Generating a heap dump
If an OutOfMemoryError (OOM) occurs on a node and stops the logpresso process, or a memory leak is suspected, you can generate a heap dump to diagnose the cause.
-
Add the following lines to the end of the
/opt/logpresso/etc/logpresso.conffile.JAVA_OPTS="$JAVA_OPTS -XX:+HeapDumpOnOutOfMemoryError" JAVA_OPTS="$JAVA_OPTS -XX:HeapDumpPath=/data/heapdump.hprof" -
Restart the
logpressoprocess.sudo systemctl restart logpresso -
When an OOM occurs afterward, a heap dump file is automatically generated at the specified path. Run the following command to check the file.
ls -lh /data/heapdump.hprof
Collecting data for failure analysis
-
Run the
jcmdcommand to find the PID of thejavaprocess runningaraqne-core. The following is an example of the command output.3370022 /logpresso/araqne-core-4.0.5-package.jar 2428126 jdk.jcmd/sun.tools.jcmd.JCmd -
Generate evidence based on the identified PID.
# Run jcmd based on the PID identified earlier. # The path where files are saved can be changed. # Run so that all evidence files are stored in a directory with sufficient free space. # Generate jmap jcmd 3370022 GC.class_histogram > /data/histogram_yyMMdd.txt # Generate JFR -> (the file is created after 60 seconds.) jcmd 3370022 JFR.start duration=60s settings=profile filename=/data/jfr_yyMMdd.jfr # Generate jstack jcmd 3370022 Thread.print > /data/jstack_yyMMdd.txt # Generate HeapDump # The file can be created as large as the Java heap memory size. Run this in a directory with ample free space if possible. jcmd 3370022 GC.heap_dump -all=true /data/heapdump_yyyyMMdd.hprof -
Export the generated evidence.
If it is not the path registered in PATH, move to the directory that contains the java file and prefix each command with './' to run the audit evidence generation commands.