Data Node Configuration
This document describes the tasks to perform after completing the package installation on data nodes. These tasks can be performed after completing the Control Node Configuration.
- Federation Communication Account Setup: Set the federation account password on the data nodes.
- Data Node Pair Setup: Register and configure data node pairs from the web console.
Federation Communication Account Setup
Connecting to the Logpresso Shell
You must connect to the Logpresso shell on data nodes A and B separately and change the initial password. It is recommended to register an SSH key in case of password loss.
Changing the Default Password
-
Run the following command in the terminal to connect to the Logpresso shell. The port number may differ depending on the SSH_PORT setting in the
logpresso.conffile (default: 7022).ssh -p 7022 root@localhost -
When the password prompt appears, enter the initial Logpresso shell password.
-
When the new password prompt appears, enter a new password and press Enter. Since the Logpresso shell account is only used for SSH access to each node, it is acceptable to set a different password for each node.
Please change the default password. New password: # Enter new password, then press Enter Retype password: # Re-enter new password, then press Enter Password changed successfully. Logpresso SNR-4.0.2511.1 (build 20250805) on Araqne Core 4.0.5 logpresso> # Logpresso shell promptCautionThe Logpresso shell rejects reuse of the default password. Never reuse the default password for any account. Logpresso is not responsible for any issues that arise from using the default password.
Depending on the operating system, the connection may fail during SSH key exchange and encryption algorithm negotiation when connecting to the Logpresso shell. Add the following content to the ~/.ssh/config file on data nodes A and B, and connect using the ssh sonar command.
Host sonar
    HostName 127.0.0.1
    Port 7022
    User root
    HostKeyAlgorithms +ssh-rsa
    PubkeyAcceptedAlgorithms +ssh-rsa
    KexAlgorithms +diffie-hellman-group14-sha1
    Ciphers +aes256-cbc
    PreferredAuthentications publickey # SSH key login
    IdentityOnly yes                   # SSH key login
    IdentityFile ~/.ssh/logpresso_rsa  # SSH key login
SSH Key Registration (Optional)
You can connect to the Logpresso shell using SSH key authentication. Registering an SSH key is recommended as it allows access even if you lose your password.
-
If you do not have an RSA key, run the following command to generate a key pair.
ssh-keygen -t rsa -b 2048 -f ~/.ssh/logpresso_rsaNoteThe Logpresso shell only supports ssh-rsa keys.
-
Run the following command in the Logpresso shell to register the SSH public key.
account.addSshKey root -
When the prompt appears, enter the SSH public key. The public key is located in the
~/.ssh/logpresso_rsa.pubfile.SSH public key? ssh-rsa AAAAB3NzaC1yc2EAAAADAQABAAACAQ... # Enter the full public key root password: # Enter the current password addedTipYou can also specify the absolute path to the public key file directly: account.addSshKey root /home/logpresso/.ssh/logpresso_rsa.pub
-
Run the following command to verify the registered SSH key list.
account.sshKeys rootRunning the command displays the registered SSH keys as follows.
Authorized SSH keys --------------------- 1: ssh-rsa AAAAB3NzaC1yc2EAAAADAQABAAACAQ... -
You can now connect to the Logpresso shell using the SSH key without a password.
ssh -p 7022 -i ~/.ssh/logpresso_rsa root@localhost
Setting the Federation Account Password
The federation account is used for communication between all nodes in the cluster. It uses the same federation account password that was already configured on the control node pair.
-
Run the following command in the Logpresso shell on data nodes A and B to change the federation account password.
dom.resetPassword localhost root -
When the new password prompt appears, enter the same federation account password that was set on the control node pair and press Enter.
New Password: # Enter the password, then press Enter- You can only enter the password once. If you enter the wrong password, re-run the
dom.resetPassword localhost rootcommand.
NoteThe federation account root and the Logpresso shell account root share the same name but belong to different authentication domains. During the federation password change process, ERROR logs may temporarily appear in araqne.log, but they will be resolved after the change is complete.
- You can only enter the password once. If you enter the wrong password, re-run the
-
Refer to this document to change the password expiration of the federation account to unlimited.
- Open a web browser and navigate to
https://<data node A IP address>:8443, then log in with the federation account. - Navigate to System > Accounts from the left menu of the web console.
- Click root in the federation account list.
- Select Unlimited in the Password Expiration field and click the Save button.
- Perform the same operation on node B.
- Open a web browser and navigate to
Data Node Pair Setup
Registering the Data Node Pair
Register the data node pair from the web console System > Cluster > Nodes screen.
-
Click the Add button at the top right of the cluster node list and configure the data node pair. For descriptions of each property, refer to Add Node Pair in the user guide.
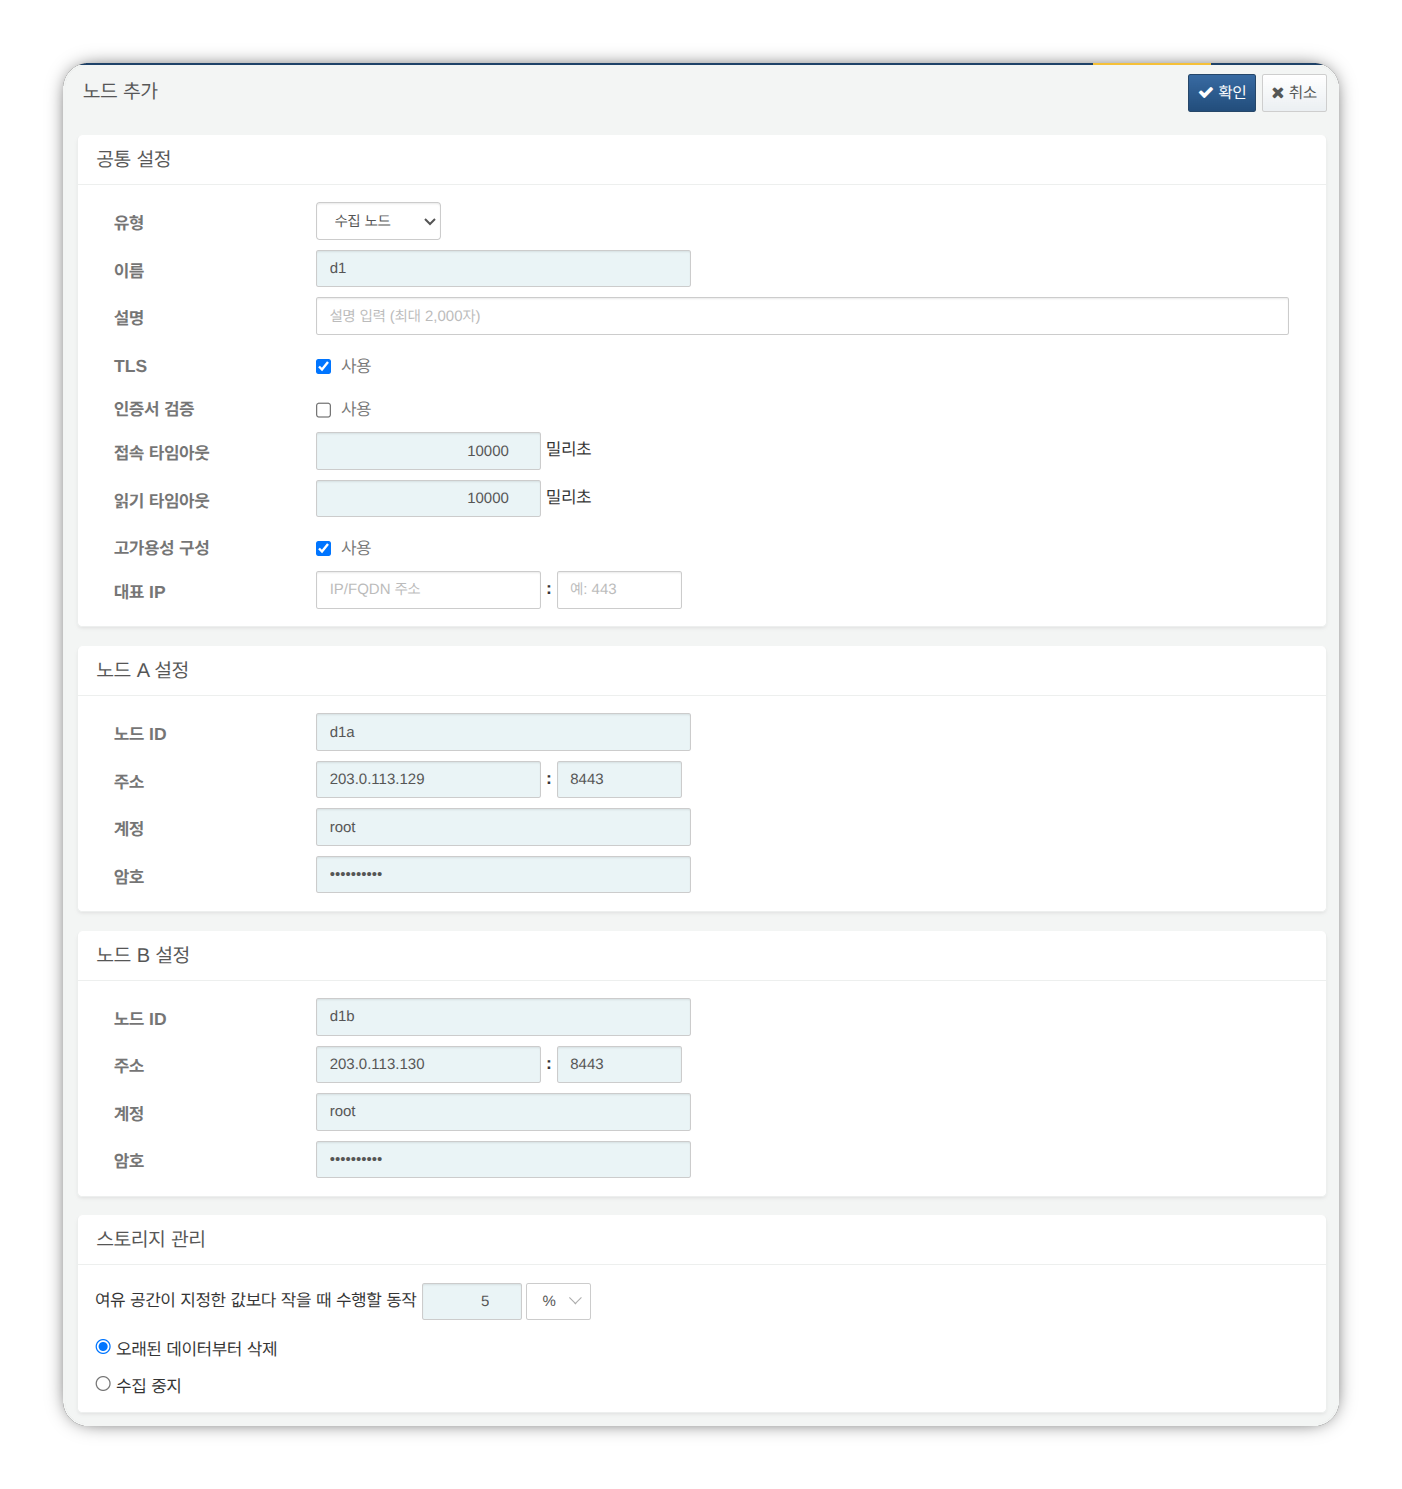
- Type: Select Data Node
- Name: Enter a data node pair identifier (e.g.,
d1)- This cannot be changed after clicking the OK button.
- Description: Description of the node pair (optional).
- TLS: Selected
- Certificate Verification: Not selected
- Connection Timeout: Use default value
- Read Timeout: Use default value
- High Availability Configuration: Selected
- Representative IP: Not selected
- Node A Settings
- Node ID: Enter the node A identifier (e.g.,
d1a) - Address: Node A actual IP address and communication port (e.g.,
200.0.113.129:8443)- The data node port number is
8443.
- The data node port number is
- Account: Enter
root - Password: Enter the federation account password
- Node ID: Enter the node A identifier (e.g.,
- Node B Settings
- Node ID: Enter the node B identifier (e.g.,
d1b) - Address: Node B actual IP address and communication port (e.g.,
200.0.113.130:8443) - Account: Enter
root - Password: Enter the federation account password
- Node ID: Enter the node B identifier (e.g.,
-
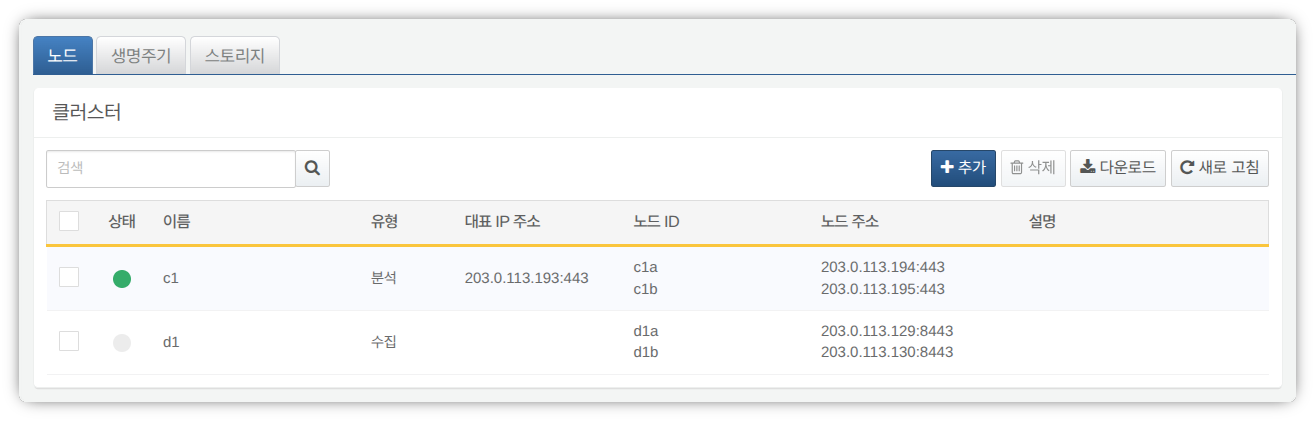
After completing the input, click the OK button. Verify that the data node pair has been added as shown below.
-
You can click the Name of the added data node to view and modify its properties. If the Name or Node ID was configured incorrectly, you must delete the node pair and reconfigure it.
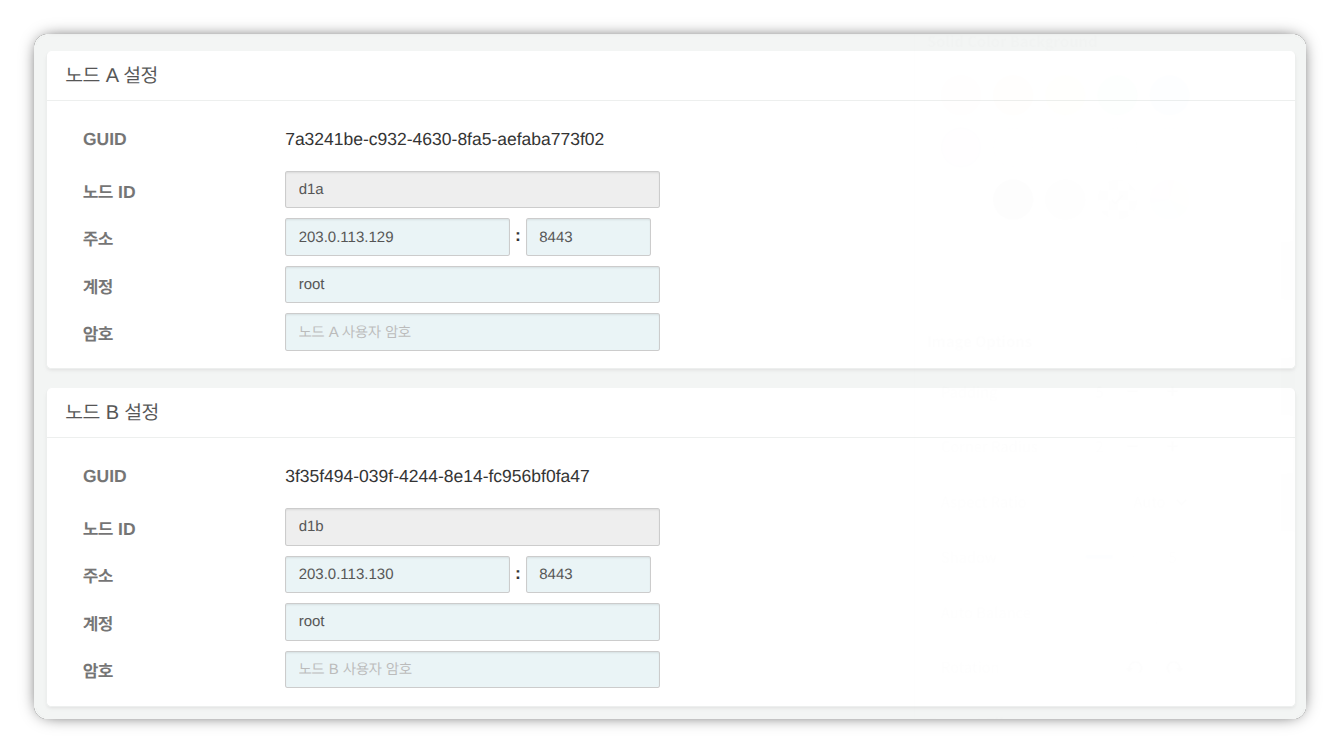
Record the GUIDs of node A and node B in a safe place. These values are used in Node GUID Configuration.
Replicating the Key Encryption Key
Replicate the control node's Key Encryption Key (KEK) identically to data nodes A and B.
-
Run the following command in the Logpresso shell on control node A or B and record the encryption key string in a safe place.
sonar.cipherKey -
Run the following command in the Logpresso shell on data nodes A and B respectively to configure the same encryption key.
KEY_STRINGis the encryption key string from the control node.sonar.setCipherKey KEY_STRING
Node GUID Configuration
Set the GUIDs of data nodes A and B confirmed in the Registering the Data Node Pair step identically in each node's Logpresso shell.
-
Run the following command in the Logpresso shell on data nodes A and B to set each node's policy synchronization GUID in the Logpresso engine.
GUID_STRINGis the GUID string for each node.sonar.setGuid GUID_STRING # Enter the GUID corresponding to each node -
You can verify each node's policy synchronization GUID with the following command.
sonar.nodeConfig
Master Node Connection Configuration
Data nodes are controlled by control nodes. Since communication is initiated by the data node connecting to the control node, you must configure the information for connecting to the policy master node.
-
Run the following command in the Logpresso shell on nodes A and B.
sonar.setMasterThe following describes the prompts displayed after running the command and the values to enter. The account used here is the federation account.
host? 203.0.113.193    # Representative IP address of the control node pair
port? 443              # Enter 443
account? root          # Enter root, the federation account
password?              # Enter the federation account password
connect timeout? 10000 # Press Enter to use the default value
read timeout? 10000    # Press Enter to use the default value
secure? true           # Enter true (default is false)
skip cert check? true  # Enter true (default is false)
Option Description Example host Representative IP address of the control node pair 203.0.113.193 port Federation communication port of the control node 443 account Federation account root password Federation account password connect timeout Server connection wait time 10000 (ms) read timeout Response wait time 10000 (ms) secure Whether to enable TLS communication true skip cert check Whether to skip TLS certificate validation true -
Run the following command to verify that the node configuration has been applied.
sonar.nodeConfigThe following is an example of the output when the configuration is set correctly.
guid: 7a3241be-c932-4630-8fa5-aefaba773f02
host=203.0.113.193, port=443, account=root, connectTimeout=10000, readTimeout=10000, secure=true, skipCertCheck=true
crypto_file_path: null
Data Replication Mode Configuration
When a node pair is configured, table data can be replicated between the two nodes. Here, "table" refers not to a database table, but to a file-based table where the Logpresso engine stores data.
If identical data exists on both nodes, duplicate searches may occur during distributed query execution. To prevent this, each node must be assigned one of two data replication modes: ACTIVE or STANDBY.
- Active node: Stores the original log table data and is included in distributed query searches.
- Standby node: Receives real-time replication of the active node's log table data. Replicated tables use the same table ID as the original, and are excluded from distributed query searches, preventing duplicate results.
The logpresso.setActiveNode command designates the peer node as active, making the local node standby.
Node A Configuration (Active)
-
Run the following command in the Logpresso shell on node A to identify the peer node (node B) name.
logpresso.nodeStatusesThe following is an example output. In the
Federation Nodessection,[d1b]is the name of node B.Local ------------------ Node GUID: b6b014f9-88c2-48c1-96c8-e23d8bdb65bc Instance GUID: af43a33f-7985-41cb-9c7b-31224e47c35a Federation Nodes ------------------ [d1b] node_guid=44494d5a-40c7-4e02-93bb-71adb50f3aec, instance_guid=3189e170-dae7-465a-a713-21e3da40cbb7, repl_mode=null, pair_guid=null, invalid_guid=false, alive=true, paired=true, failure=false, last connect=2025-06-09 13:39:20, last alive=2025-06-10 14:08:08, created=2025-06-09 13:39:20NoteThe Node GUID and Instance GUID displayed in the logpresso.nodeStatuses command output are identifiers used by the Logpresso engine for log table replication and distributed queries. The Node GUID is used for database identification and is permanently stored in the DB_GUID file. The Instance GUID is a process identifier for the currently running instance and changes each time the node process starts.
-
Run the following command to designate node B as the standby node, which makes node A the active node. In the command example,
d1bis the name of node B confirmed above.logpresso.setStandbyNode d1b -
Running the
logpresso.nodeStatusescommand again shows thatReplication Modeis set toACTIVEin theLocalsection.------------------ Node GUID: b6b014f9-88c2-48c1-96c8-e23d8bdb65bc Instance GUID: af43a33f-7985-41cb-9c7b-31224e47c35a Replication Mode: ACTIVE Pair Node: d1b Federation Nodes ------------------ [d1b] node_guid=44494d5a-40c7-4e02-93bb-71adb50f3aec, instance_guid=3189e170-dae7-465a-a713-21e3da40cbb7, repl_mode=null, pair_guid=null, invalid_guid=false, alive=true, paired=true, failure=false, last connect=2025-06-09 13:49:36, last alive=2025-06-10 14:08:08, created=2025-06-09 13:49:36
Node B Configuration (Standby)
-
Run the following command in the Logpresso shell on node B to designate node A as active, which makes node B the standby node.
c1ais the name of node A confirmed from thelogpresso.nodeStatusescommand output.logpresso.setActiveNode d1a -
Running the
logpresso.nodeStatusescommand shows thatReplication Modeis set toSTANDBYin theLocalsection.Local ------------------ Node GUID: 44494d5a-40c7-4e02-93bb-71adb50f3aec Instance GUID: 3189e170-dae7-465a-a713-21e3da40cbb7 Replication Mode: STANDBY Pair Node: d1a Federation Nodes ------------------ [d1a] node_guid=6b6b014f9-88c2-48c1-96c8-e23d8bdb65bc, instance_guid=af43a33f-7985-41cb-9c7b-31224e47c35a, repl_mode=ACTIVE, pair_guid=44494d5a-40c7-4e02-93bb-71adb50f3aec, invalid_guid=false, alive=true, paired=true, failure=false, last connect=2025-03-26 17:03:11, last alive=2025-03-27 13:40:55, created=2025-03-26 17:03:11
System Log Forwarding Configuration
Configure the collection of performance data such as CPU and memory from data nodes. The collected data can be viewed on the web console System > Performance Monitor screen.
-
Run the
sentry.setGuidcommand in the Logpresso shell on data nodes A and B respectively to set the sentry GUID. Here, GUID refers to the node ID. For example, if the node ID of data node A isd1a, configure it as follows.sentry.setGuid d1a -
Run the following command on data nodes A and B to configure the control node to which logs will be forwarded.
# sentry.addBase BASE_NAME IP_ADDR PORT SENTRY_CERT CA_CERT SWAP_SIZE sentry.addBase c1 203.0.113.193 7140 logpresso-sentry logpresso-ca 1073741824BASE_NAME: Name of the control node pair (e.g.,c1)IP_ADDR: Representative IP address of the control node pair (e.g.,203.0.113.193)PORT: Sentry port (e.g.,7140)SENTRY_CERT: Sentry certificate (e.g.,logpresso-sentry)CA_CERT: Logpresso CA certificate (e.g.,logpresso-ca)SWAP_SIZE: Swap size (e.g.,1073741824(=1GB), unit: bytes)
-
Run the following command to verify the connection.
sentry.connectionsThe following is an example of the output when the configuration is set correctly.
Connections
--------------------
[c1] id=2035698886, peer=(1b3fcc3f-61ce-41ae-9c45-d0096b8b7fff, /203.0.113.193:7140), trusted level=Low, ssl=true, props={phase=post_hello, type=command}
Inter-Node License Sharing Configuration
Configure all nodes in the cluster to use the same license. The license registered on the control node is also applied to data nodes and forwarder nodes. This section describes how to apply the control node license to data nodes.
-
Run the following command in the Logpresso shell on nodes A and B to enable license sharing.
logpresso.setLicenseMode slave -
Run the following command to check the license master status.
logpresso.licenseModeIf configured correctly, the following output is displayed.
SLAVE -
(Control nodes A, B) Refer to this document to register the data nodes as license slaves.
- Open a web browser and navigate to
https://<control node A IP address>:8443. - Log in with the federation account and navigate to Settings > License Management.
- Click Add New Node in the All Nodes List.
- Enter the license slave node information and click Create.
- Name: Name to identify the data node (e.g.,
d1a,d1b) - Host Address: IP address of the data node
- Port: Federation communication port of the data node. Enter 8443.
- User: Federation account ID (
root) - Password: Password of the federation account
- Encrypted Communication: Select Enabled.
- Server Certificate Verification: Uncheck if Enabled is checked.
- Connection Timeout: Use the default value.
- Read Timeout: Use the default value.
- Name: Name to identify the data node (e.g.,
- Perform the same operation on control node B.
- Open a web browser and navigate to
Enabling Distributed Queries
Distributed Query is a feature that allows querying table data distributed across multiple nodes with a single query. To prevent duplicate searches and obtain correct query results when executing distributed queries, distributed queries must be enabled on all nodes.
-
Run the following command in the Logpresso shell on nodes A and B respectively to enable distributed queries.
logpresso.enablePlanner -
Run the following command to check the distributed query status.
logpresso.plannerStatusIf enabled correctly, the following output is displayed.
Running: true
Web Server Configuration
After package installation, there are open web service ports. Close unnecessary ports and only open the ports required for data node operation.
-
Run the following command in the Logpresso shell to check the open web service ports.
httpd.bindingsThe following is an example of the output.
/0.0.0.0:8443 (ssl: key logpresso-web, trust null), opened, default context: webconsole, idle timeout: 0seconds, log file prefix: null, access log: false, error log: false /0.0.0.0:18443 (ssl: key logpresso-web, trust null), opened, default context: sonar-explanation, idle timeout: 0seconds, log file prefix: null, access log: false, error log: false /0.0.0.0:443 (ssl: key logpresso-web, trust null), opened, default context: sonar, idle timeout: 0seconds, log file prefix: null, access log: false, error log: false /0.0.0.0:44300 (ssl: key logpresso-web, trust null), opened, default context: deploy, idle timeout: 0seconds, log file prefix: null, access log: false, error log: false -
Run the following commands to close all open web ports and reopen only the port used for federation communication, applying the certificate changes.
httpd.close 8443
httpd.close 18443
httpd.close 443
httpd.close 44300
httpd.openSsl 8443 webconsole logpresso-web
WebSocket Frame Configuration (Optional)
Since federation communication uses WebSockets, the default WebSocket frame size may cause transmission failures when distributed query results are large or there is a lot of data to transfer. To handle large volumes of data smoothly, the frame size must be increased.
-
Run the following command in the Logpresso shell on nodes A and B to check the current setting.
webconsole.maxFrameSizeThe default value is 8MB, and the command output is as follows.
8,388,608 bytes -
Run the following command to change the frame size. The value set in this example is 84MB.
webconsole.setMaxFrameSize 83886080 -
Run the
webconsole.maxFrameSizecommand again to verify the changed value.83,886,080 bytes
Query Cache Configuration
To optimize query performance, table metadata, inverted indexes, and bloom filters are cached in memory. The role of each cache is as follows.
- Table cache: Caches log data read from disk during queries, returning the same data directly from memory without disk I/O on subsequent requests.
- Inverted index cache: Caches the list of document IDs containing a specific search term for full-text search.
- Bloom filter 0/1 cache: A bloom filter is a probabilistic data structure that quickly determines whether a specific search term exists in a given segment. Bloom filter 0 is used for fast determination, and bloom filter 1 is used for precise determination.
Run the following commands in the Logpresso shell on nodes A and B to set the cache sizes.
logpresso.tableCacheConfig max_weight CACHE_SIZE               # Table cache
logpresso.indexCacheConfig inverted max_weight CACHE_SIZE      # Inverted index cache
logpresso.indexCacheConfig bloomfilter0 max_weight CACHE_SIZE  # Bloom filter 0 cache
logpresso.indexCacheConfig bloomfilter1 max_weight CACHE_SIZE  # Bloom filter 1 cache
Enter the values from the following table for CACHE_SIZE, considering the daily processing volume and memory capacity. The input unit for cache size is bytes.
| Daily Volume | RAM | HEAP | DM | max_weight | inverted | bloomfilter0 | bloomfilter1 |
|---|---|---|---|---|---|---|---|
| 500GB/day | 128GB | 26GB | 76GB | 4,294,967,296 | 53,687,091,200 | 12,884,901,888 | 1,073,741,824 |
- max_weight: Table cache
- inverted: Inverted index cache
- bloomfilter0: Bloom filter 0 cache
- bloomfilter1: Bloom filter 1 cache
- Do not enter commas (
,). Commas are shown only for readability to separate digit groups.
The cache sizes converted to GB are shown in the following table.
| Daily Volume | RAM | HEAP | DM | max_weight | inverted | bloomfilter0 | bloomfilter1 |
|---|---|---|---|---|---|---|---|
| 500GB/day | 128GB | 26GB | 76GB | 4GB | 50GB | 12GB | 1GB |
Restarting the Service
The Logpresso service must be restarted to apply the changed settings. The order of operations is as follows.
- Stop order: Standby then Active
- Start order: Active then Standby
By default, node A is active and node B is standby. Starting the active node first during system operation allows for quick recovery of the original data service, and the standby node can immediately establish a replication connection upon startup.
To stop the nodes,
-
Run the following command on the standby node (node B) to stop the Logpresso service.
sudo systemctl stop logpresso -
After node B has stopped, run the same command on active node A to stop the service.
To start the nodes,
-
Run the following command on node A to start the Logpresso service.
sudo systemctl start logpresso -
After node A starts successfully, run the same command on node B to start the Logpresso service.
-
After logging into the web console on node A, verify that the status of each data node is displayed in green on the System > Performance Monitor screen.
Connecting Stream Queries with the Control Node
Configure a pipeline so that event data generated by real-time detection rules on data nodes is forwarded to the control node for final event processing (alert). The role of each component is as follows.
sonar_event_logger(data node): A stream collector that collects the output of thesonar_eventstream query on the data nodesonar_event_data(control node): A stream query that reads data from the data node'ssonar_event_loggersonar_event(control node): A stream query that receivessonar_event_dataas input, executes thealertcommand, and processes and stores events
The final data flow is configured as follows: (data nodes A, B) sonar_event_logger -> (control nodes A, B) sonar_event_data -> (control nodes A, B) sonar_event
Creating the sonar_event_logger Collector
-
(Data nodes A, B) Run the following command in the Logpresso shell to create the
sonar_event_loggercollector.# logapi.createLogger LOGGER_FACTORY_NAME NAMESPACE LOGGER_NAME logapi.createLogger stream local sonar_event_loggerLOGGER_FACTORY_NAME: Collector factory name. Enterstream.NAMESPACE: Collector namespace. Enterlocal.LOGGER_NAME: Name of the collector to create. Entersonar_event_logger.
The following describes the prompts displayed after running the command and the values to enter.
Stream query name (required)? sonar_event # Enter sonar_event
transformer (optional, enter to skip)?    # Press Enter to skip
Stream query name: Name of the data stream query that will receive the collected logs. Entersonar_event.transformer: Press Enter without entering anything.
After entering all values at the prompts, the created collector information is displayed as follows.
logger created: name=local\sonar_event_logger, factory=local\stream, status=stopped (passive), log count=0, log volume=0, last start=null, last run=null, last log=null -
(Data nodes A, B) Run the
logapi.loggerscommand to verify that thesonar_event_loggercollector has been created. The following is an example output, where thesonar_event_loggercollector showsdisabledfor theenabledfield andstoppedfor thestatusfield.Loggers ---------------------- +------------------------------+--------------------+----------+---------+------------+----------+------------+-----------+---------------------------+-------------+-------+ | name | factory | enabled | status | intvl.(ms) | schedule | time range | log count | last log | stop reason | error | +------------------------------+--------------------+----------+---------+------------+----------+------------+-----------+---------------------------+-------------+-------+ | local\sonar_system_alert | system-alert | enabled | running | 0 | null | null | 17 | 2025-07-09 15:09:59 +0900 | | | | local\sonar_event_logger | stream | disabled | stopped | 0 | null | null | 0 | null | | | +------------------------------+--------------------+----------+---------+------------+----------+------------+-----------+---------------------------+-------------+-------+ -
(Control node A) Run the
logapi.loggerscommand in the Logpresso shell to query the list of currently created collectors. The collectors created on the data nodes are displayed under each data node's namespace (d1a,d1b).Loggers ---------------------- +--------------------------------+--------------------+----------+---------+------------+----------+------------+-----------+---------------------------+-------------+-------+ | name | factory | enabled | status | intvl.(ms) | schedule | time range | log count | last log | stop reason | error | +--------------------------------+--------------------+----------+---------+------------+----------+------------+-----------+---------------------------+-------------+-------+ | d1a\sonar_event_logger | stream | disabled | stopped | 0 | null | null | 0 | null | | | | d1a\sonar_system_alert | system-alert | enabled | running | 0 | null | null | 17 | 2025-07-09 15:09:59 +0900 | | | | d1b\sonar_event_logger | stream | disabled | stopped | 0 | null | null | 0 | null | | | | d1b\sonar_system_alert | system-alert | enabled | running | 0 | null | null | 23 | 2025-07-09 15:09:59 +0900 | | | | local\sonar_system_alert | system-alert | enabled | running | 0 | null | null | 72 | 2025-07-09 16:17:10 +0900 | | | +--------------------------------+--------------------+----------+---------+------------+----------+------------+-----------+---------------------------+-------------+-------+ -
(Control node A) Run the following command to register the data node collectors as managed targets. Collectors registered as managed targets are automatically started on system restart, and state synchronization is performed in HA environments.
# logpresso.createLogger NAMESPACE\LOGGER_NAME logpresso.createLogger d1a\sonar_event_logger logpresso.createLogger d1b\sonar_event_loggerNAMESPACE\LOGGER_NAME: Full name of the collector. Enter the collector name confirmed in step 3.
-
(Control node A) Run the following command to enable the collectors.
# logapi.startLogger NAMESPACE\LOGGER_NAME logapi.startLogger d1a\sonar_event_logger logapi.startLogger d1b\sonar_event_loggerNAMESPACE\LOGGER_NAME: Full name of the collector. Enter the collector name confirmed in step 3.
-
(Control node A) Run the
logapi.loggerscommand and verify that thesonar_event_loggercollectors showenabledfor theenabledfield andrunningfor thestatusfield in the output.Loggers ---------------------- +--------------------------------+--------------------+---------+---------+------------+----------+------------+-----------+---------------------------+-------------+-------+ | name | factory | enabled | status | intvl.(ms) | schedule | time range | log count | last log | stop reason | error | +--------------------------------+--------------------+---------+---------+------------+----------+------------+-----------+---------------------------+-------------+-------+ | d1a\sonar_event_logger | stream | enabled | running | 0 | null | null | 0 | null | | | | d1a\sonar_system_alert | system-alert | enabled | running | 0 | null | null | 17 | 2025-07-09 15:09:59 +0900 | | | | d1b\sonar_event_logger | stream | enabled | running | 0 | null | null | 0 | null | | | | d1b\sonar_system_alert | system-alert | enabled | running | 0 | null | null | 23 | 2025-07-09 15:09:59 +0900 | | | | local\sonar_system_alert | system-alert | enabled | running | 0 | null | null | 72 | 2025-07-09 16:17:10 +0900 | | | +--------------------------------+--------------------+---------+---------+------------+----------+------------+-----------+---------------------------+-------------+-------+
Creating the sonar_event_data Stream Query
Perform the following process to forward data collected by the data node collectors to the sonar_event stream query on the control node.
-
(Control node A) Run the following command in the Logpresso shell to create a stream query.
# logpresso.createStreamQuery NAME SOURCE_TYPE logpresso.createStreamQuery sonar_event_data loggerNAME: Name of the stream query. Entersonar_event_data.SOURCE_TYPE: Data source type. Enterlogger.
The following describes the prompts displayed after running the command and the values to enter.
interval? 60 # Enter 60 (seconds) query? bypass # Enter bypass loggers? d1a\sonar_event_logger, d1b\sonar_event_logger # Enter the full name list of collectors on data nodes A and B owner? root # Enter the owner account name async [y/N]? N # Enter Ninterval: Execution interval of the stream query. Enter60.query: Query string of the stream query. Enterbypass.loggers: Full name of the collectors to connect. Enterd1a\sonar_event_logger.owner: Owner account name. Enterroot.async: Whether to run in asynchronous mode. EnterN.
-
Run the
logpresso.streamQueriescommand and verify that thesonar_event_datastream query appears in the stream query list. The following is an example output, where thesonar_event_datastream query showstruefor theenabledfield andtruefor therunningfield.Stream Queries ---------------- +-----------------------------------------+-------------+--------------+---------------------+---------+---------+-------+-------+ | name | input count | output count | last refresh | running | enabled | async | error | +-----------------------------------------+-------------+--------------+---------------------+---------+---------+-------+-------+ | sonar_event | 0 | 0 | 2025-07-09 15:14:54 | true | true | false | null | | sonar_event_data | 0 | 0 | 2025-07-09 15:21:35 | true | true | false | null | | ..... | +-----------------------------------------+-------------+--------------+---------------------+---------+---------+-------+-------+
Connecting the sonar_event Stream Query
Now connect the data source stream query created above to the sonar_event stream query on control node A.
-
Run the following command on the Logpresso web console Analysis > Query screen to generate a stream query list with sonar_event_data added.
system-streams | search name == "sonar_event" | eval streams = format("sonar_event_data,%s", strjoin(",", input_streams)) | fields streams -
Copy the value in the
streamsfield to a safe place. You will need to enter this value at thestreamsprompt in the next step. -
Run the following command to connect the
sonar_eventstream query with thesonar_event_datastream query.# logpresso.updateStreamQuery NAME SOURCE_TYPE logpresso.updateStreamQuery sonar_event STREAM # Enter STREAM in uppercaseNAME: Name of the stream query. Entersonar_event.SOURCE_TYPE: Data source type. EnterSTREAM.
The following describes the prompts displayed after running the command and the values to enter.
interval? 0 # Enter 0 query? alert # Enter alert streams? sonar_rule_00001,sonar_rule_00003,sonar_rule_00005, ..., sonar_rule_00051,sonar_event_data # Value copied from the streams field async [y/N]? N # Enter N owner? root # Enter the owner account nameCautionThe logpresso.updateStreamQuery command overwrites all existing data, so use it with caution. When entering values at the stream prompt, you must accurately enter the stream list queried from the input_streams field and sonar_event_data, separated by commas (,).
Control Node Pair Synchronization
The sonar_event_logger collector and the sonar_event_data and sonar_event stream queries configured above were manually created in the Logpresso shell and do not support automatic redundancy through synchronization.
You must stop cluster synchronization, perform the same configuration steps on control node B as were performed on control node A, and then restart the cluster.
-
(Control node A) Stop the
logpressoservice from the terminal.sudo systemctl stop logpresso -
(Control node B) Run the following command in the Logpresso shell to unregister the remaining collectors on control node B from managed targets and delete the collector instances.
# logapi.removeLogger NAMESPACE\LOGGER_NAME logapi.removeLogger d1a\sonar_event_logger logapi.removeLogger d1b\sonar_event_loggerNAMESPACE\LOGGER_NAME: Full name of the collector
-
(Data nodes A, B) Create the collectors on data nodes A and B.
# Create sonar_event_logger collector logapi.createLogger stream local sonar_event_logger -
(Control node B) Perform the same operations on control node B as were performed on control node A.
# Create sonar_event_logger collectors logpresso.createLogger d1a\sonar_event_logger logpresso.createLogger d1b\sonar_event_logger # Enable sonar_event_logger collectors logapi.startLogger d1a\sonar_event_logger logapi.startLogger d1b\sonar_event_logger # Create sonar_event_data stream query logpresso.createStreamQuery sonar_event_data logger # Check the input_streams field value from the stream query list on control node B system streams | search name == "sonar_event_data" | order source_type, name, running, enabled, async, interval, query_string, owner, input_streams # Connect sonar_event stream query logpresso.updateStreamQuery sonar_event STREAM -
(Control node B) Run the following command in the terminal to stop the
logpressoservice.sudo systemctl stop logpresso -
(Control node A, then control node B) Run the following command in the terminal to start the
logpressoservice. Once control node A starts first, its configuration will be synchronized to control node B.sudo systemctl start logpresso