Event Summary
Overview
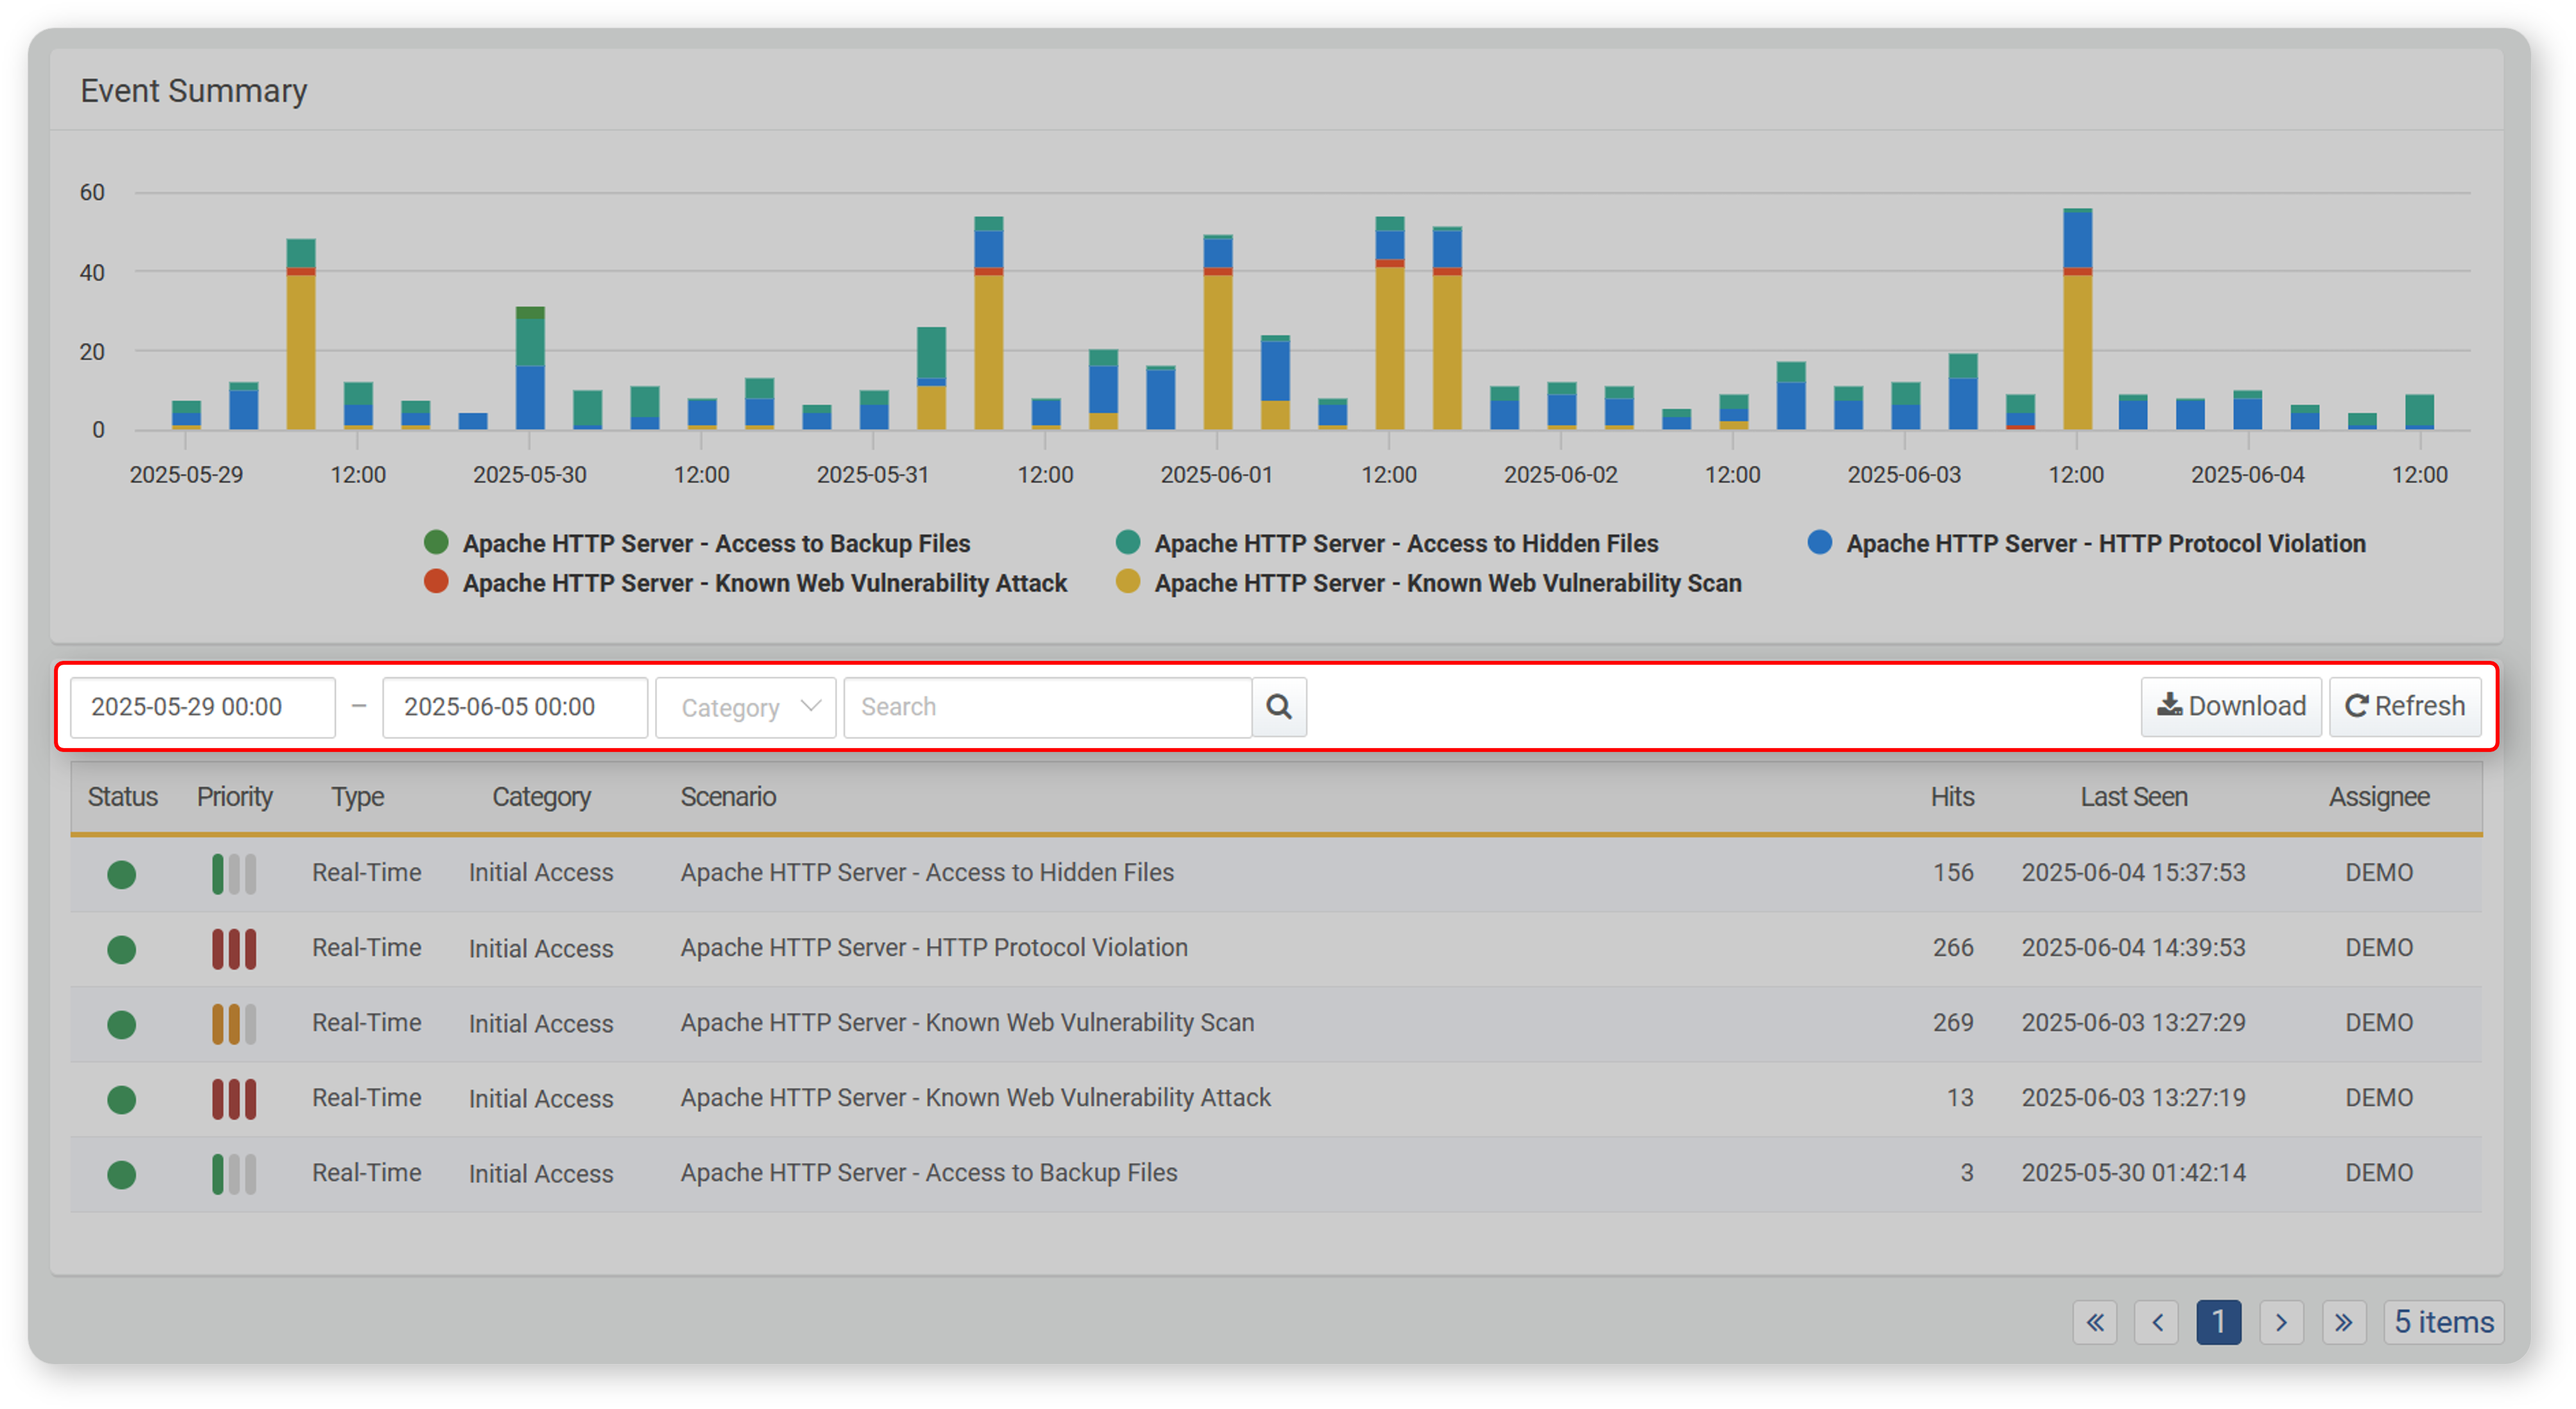
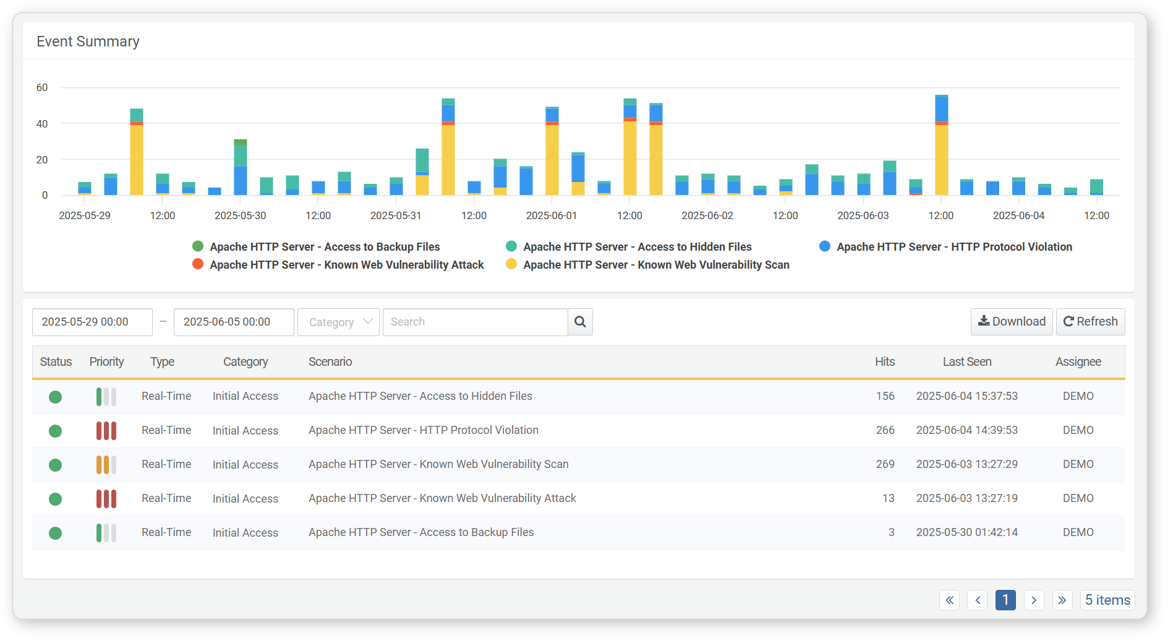
The Event Summary provides a visual representation of event detection status by scenario. It consists of a chart showing the number of detected events per detection scenarios, and a list view. Users can narrow down results by specifying a time period, selecting event classifications, or entering keywords.
Toolbar
Above the event summary list, a toolbar allows users to filter and search detection results. When filters or search conditions are applied, both the chart and the list are updated in real time. The toolbar also provides options to download the current event summary list or refresh it to reflect the latest data.
Period/Category Filter
By specifying the time period and event classification, the chart and list are updated to reflect the selected conditions. The following image shows an example of a Period filter (indicating when events occurred) and a Category filter applied to the list.
The available filters in the toolbar are as follows:
- Period: Select the date range for querying events (default: from 00:00 of the current day to 00:00 of the next day; 00:00 of the next day is excluded from the search). You can enter the range directly in the input box or use the time picker that appears when clicking the box.
- Category: Select the event category to filter by (default: all selected). Event classification is based on the categories defined in the detection rules. These categories can be managed under Policy > Strean Rules or Batch Rules in the Categories.
Search
To find a specific event in the event summary list, use the search tool located in the toolbar. This tool searches for detection entries that include the entered keyword in the Scenario field. The search is not case-sensitive.
Download
To download the current event summary list:
-
Click Download in the toolbar.
-
In the Download Event Summary window, enter or select the following options, then click OK.
- File Name: The name of the file to be downloaded (default: Ticket)
- Columns: The event summary properties to include in the file. Click Select All to include all available fields.
- File Format: The format of the file to be downloaded (default: CSV)
- CSV: CSV file
- Excel XML: XML file that can be opened in Microsoft Excel
- Microsoft Word: DOCX file
- HTML: HTML file
- JSON: JSON file
- PDF: PDF file
- Encoding: File encoding (UTF-8, UTF-16 BE, MS949, default: MS949)
- Range: The number of event summaries to include. Only the most recently registered items will be saved, in reverse chronological order up to the specified limit.
Refresh List
To view the event summary list with the latest information, click Refresh in the toolbar.
Event Summary Chart
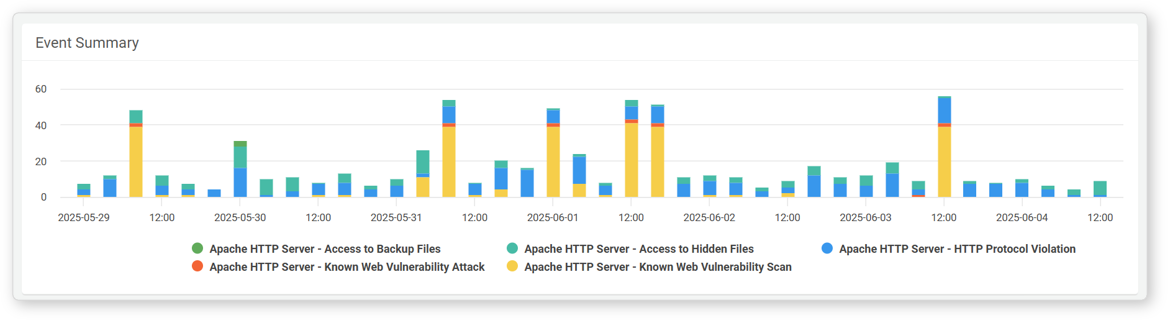
The event summary chart displays the number of detections per scenario over the past 7 days.
- X-axis: Time
- Y-axis: Number of Detections
Scenario Filter
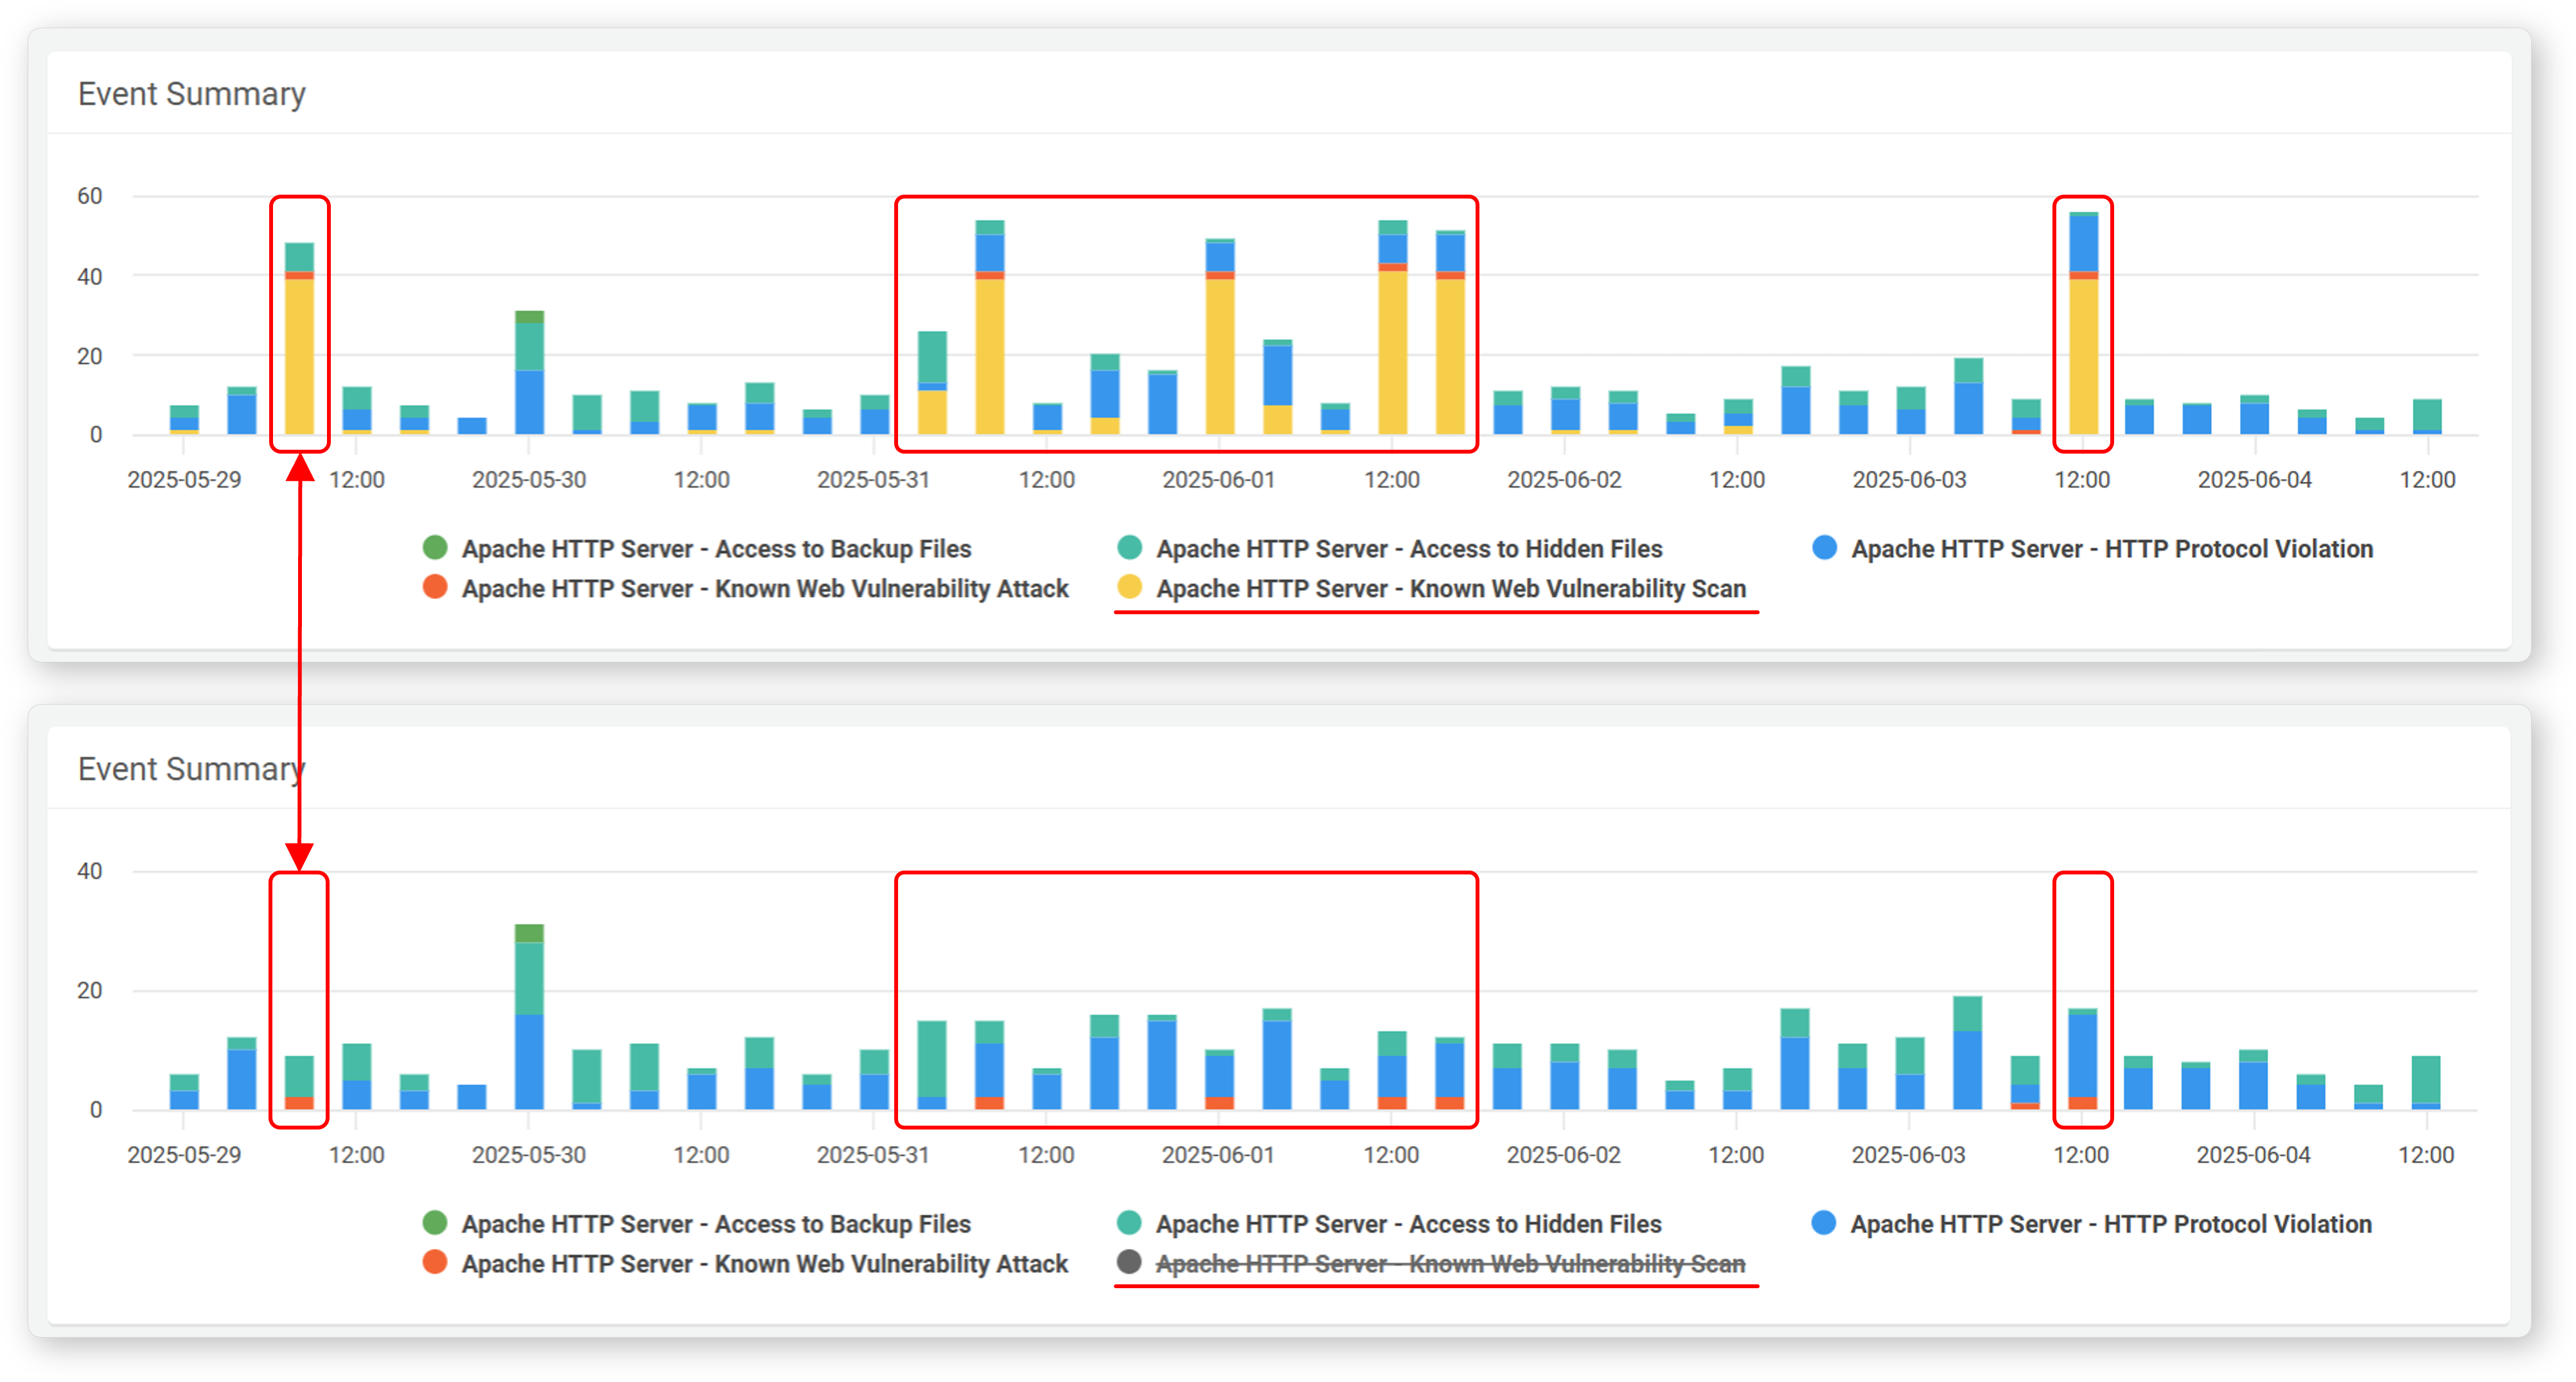
At the bottom of the chart is a scenario legend. Click a specific scenario in the legend to toggle its visibility in the chart.
Period Filter
To limit the chart to a specific time period, hover the mouse over the chart and drag to select a time range.
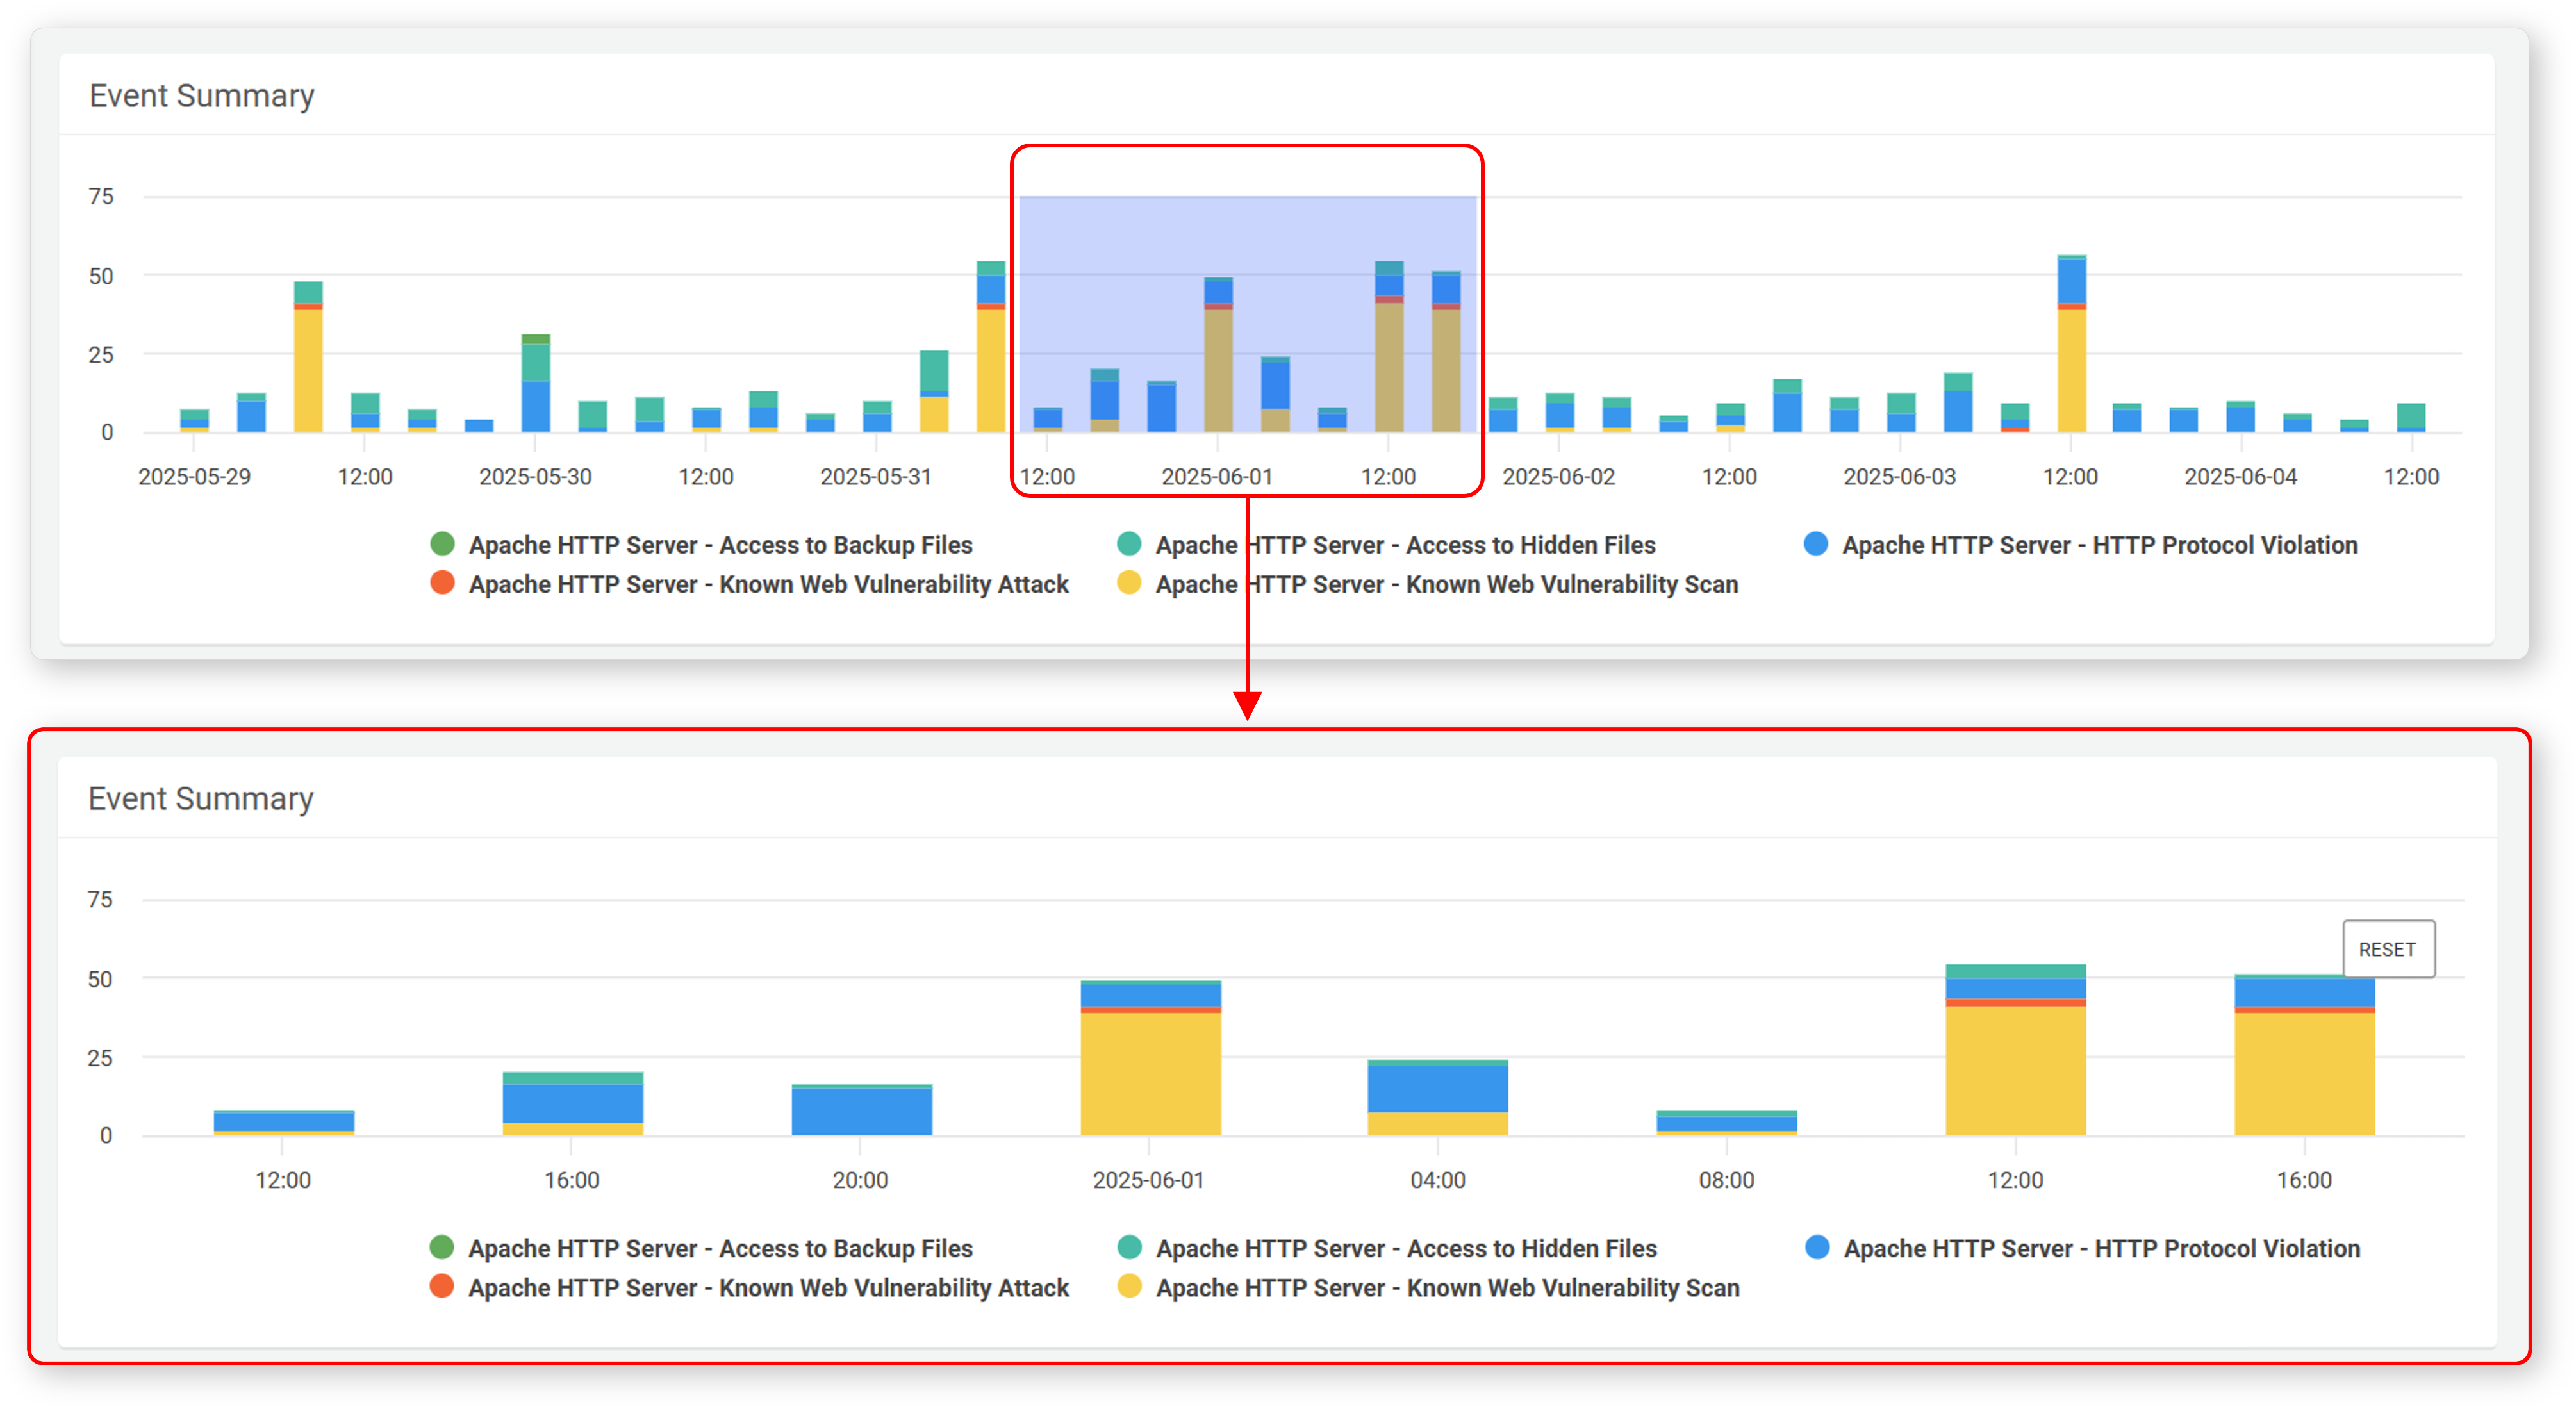
Clicking RESET on the chart will clear the event period filter.
Event Summary List
The event summary list displays classification, occurrence count, importance, and other details of events detected over the past 7 days, based on detection scenarios. The list is sorted by the most recent detection time. Scenarios with no detected events will not appear in the list.
The information available in the event summary list includes:
- Status: Status of the detection rule (Green: Active, Gray: Inactive)
- Priority: Severity level of the event as defined in the rule (High/Medium/Low)
- Type: Type of rule (Stream/Batch)
- Category: Classification information applied to events by the scenario
- Scenario: Name of the scenario that detected the event
- Hits: Number of event occurrences
- Last Seen: Timestamp of the most recently detected occurrence
- Assignee: The person assigned to handle the related Ticket. If unassigned, this field will display Unassigned.
View Event Details by Scenario
To view detailed information about an event:
- In the event summary list, click the name of the scenario for the event you want to inspect.
- In the popup window, detailed information about the detected events for the specific scenario can be viewed.
✅ The actions available in the event detail view are the same as those available in the events section.