Logs
Overview
Under Analysis > Logs, you can browse the data collected by loggers. You can narrow the search scope by specifying the logger, log schema, time range, and additional filters.
Before using the log search feature, it’s important to understand the role of logger models. The data collection process is defined within each logger model (see the diagram below). Loggers are created based on logger models, which define both the parser and log schema used for normalization. As a result, the data stored in tables includes both the raw logs and their normalized forms.
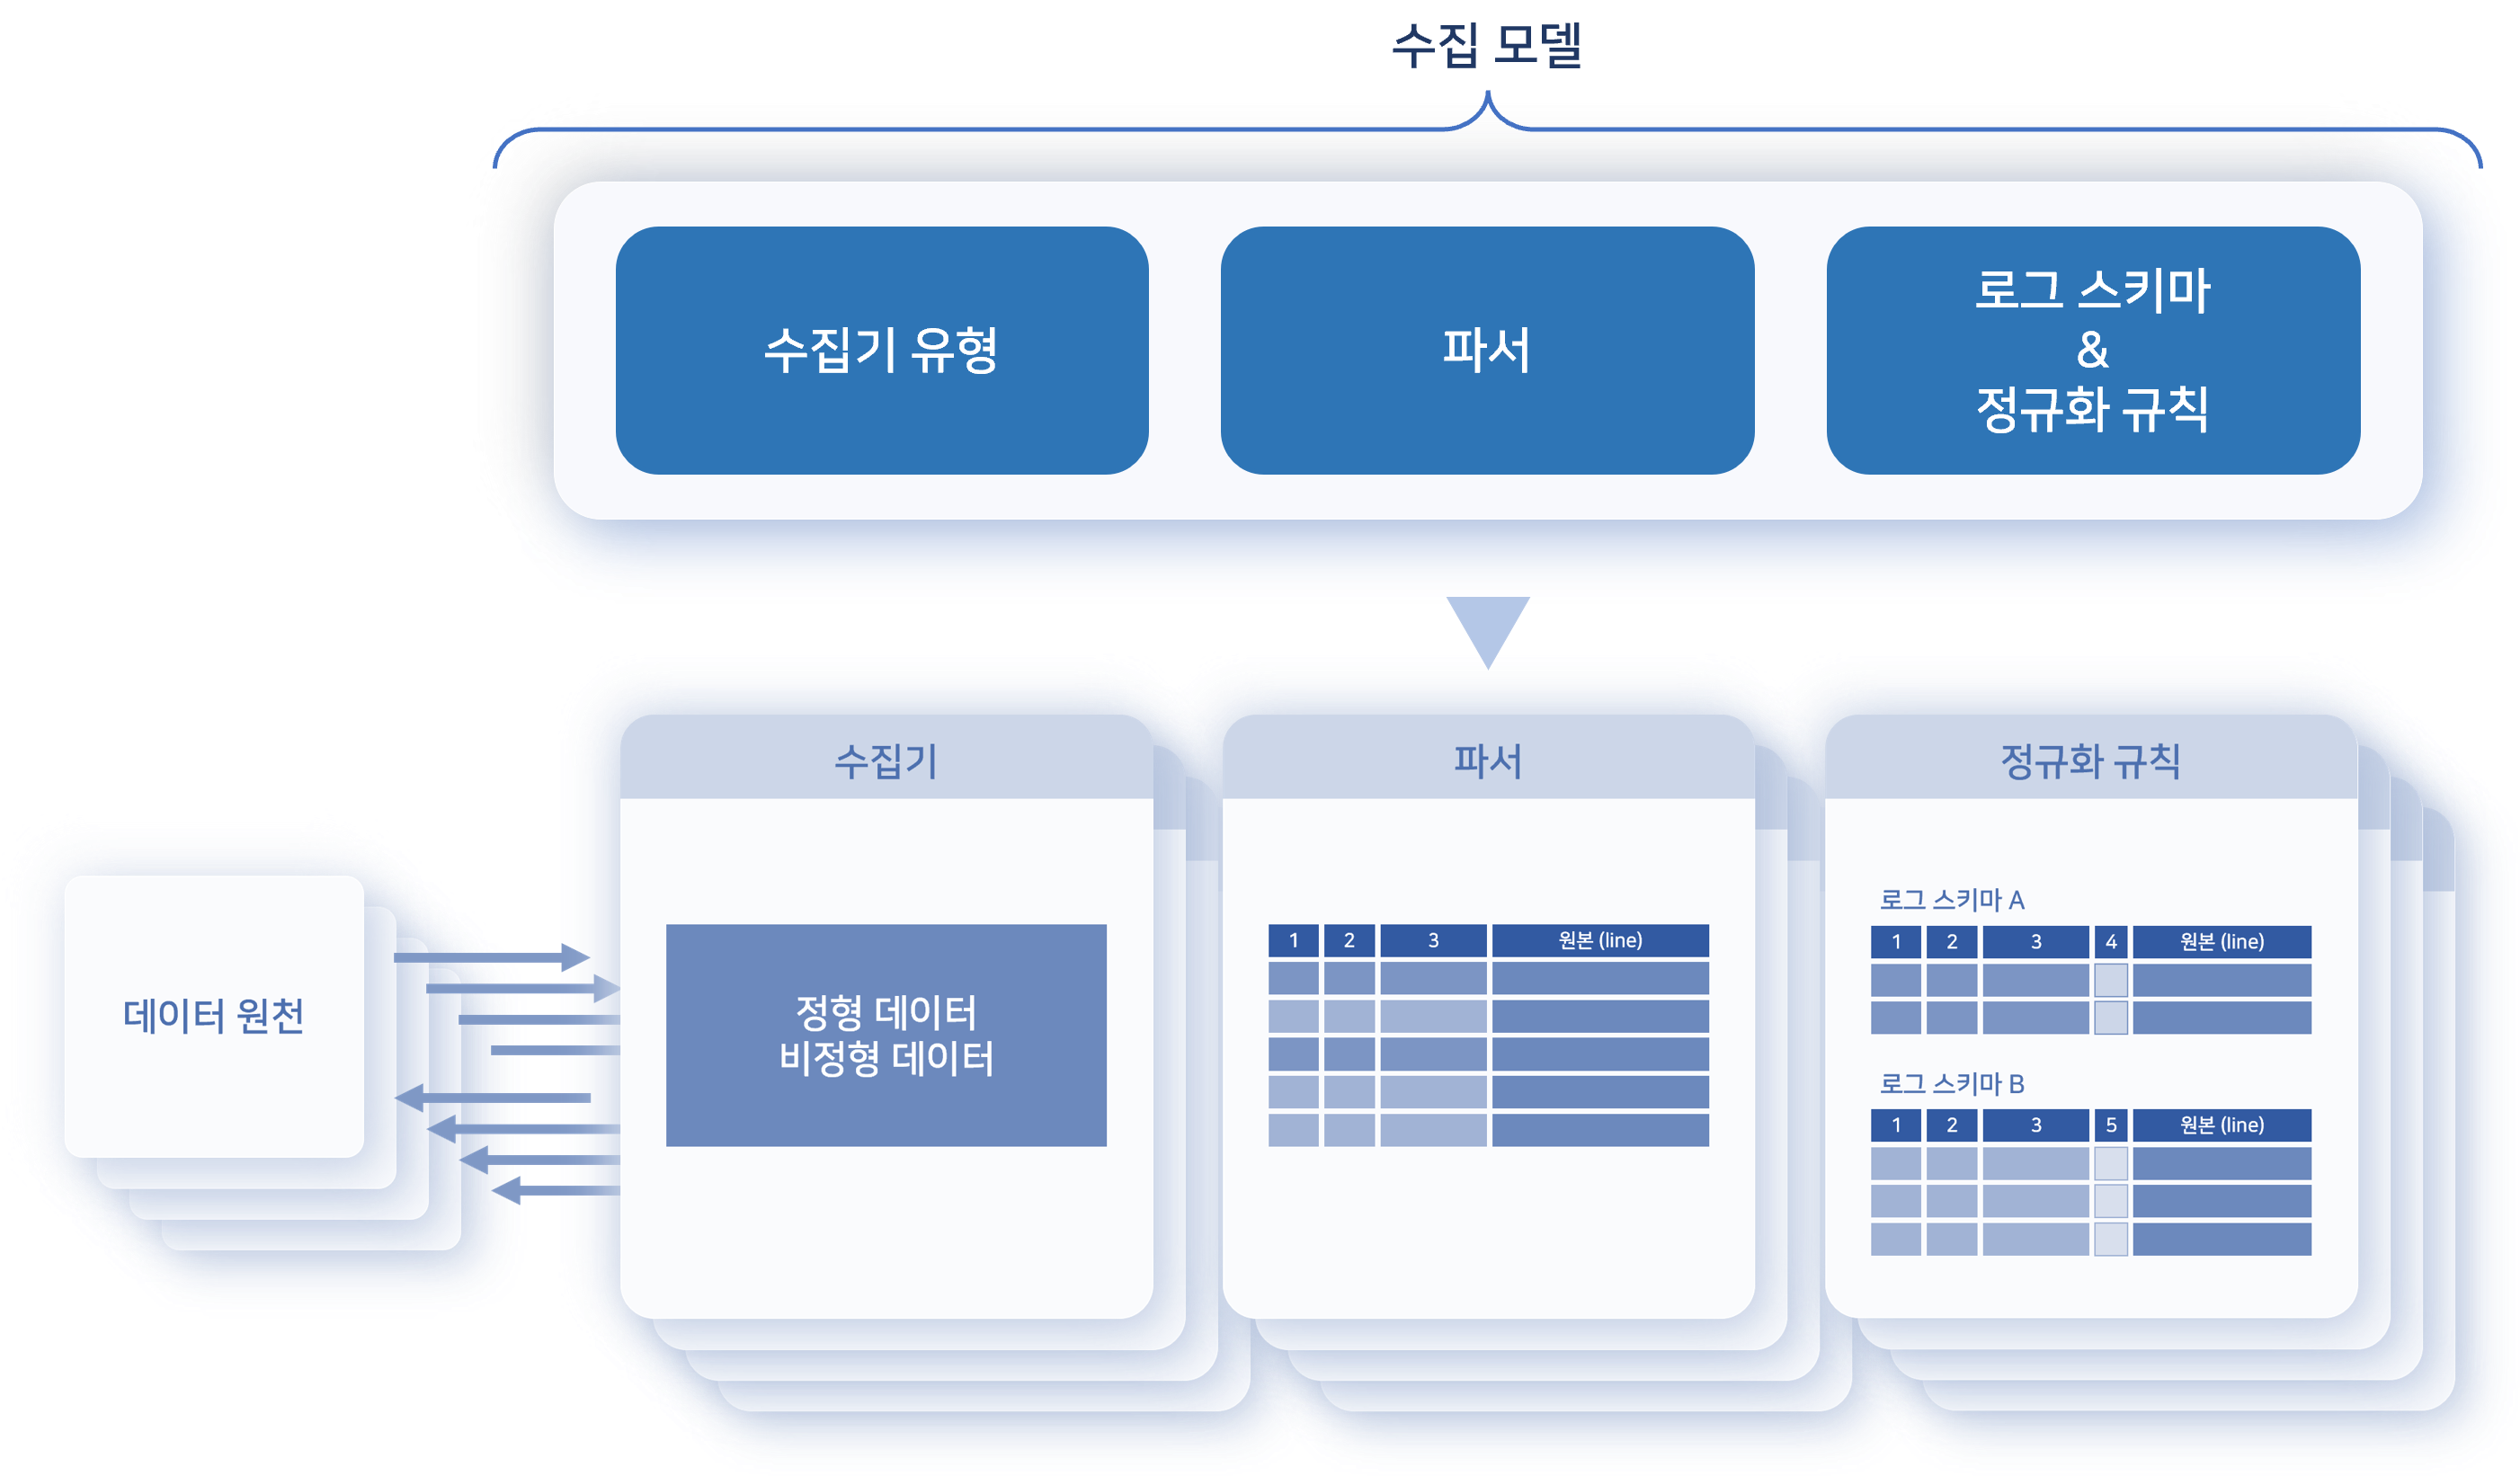
Depending on your needs, you can view either the raw data or normalized logs using an applicable log schema.
Query Logs
To query logs:
- Go to Analysis > Logs.
- In the toolbar, select the Logger, Schema, Time Range, and Maximum Records to view, then click Run.
- After executing the query, you can refine the results using the following options:
- Limit the data range using filters
- Hide or show specific fields
- Sort records by a selected field in ascending or descending order
- Apply field-based search filters to narrow down results
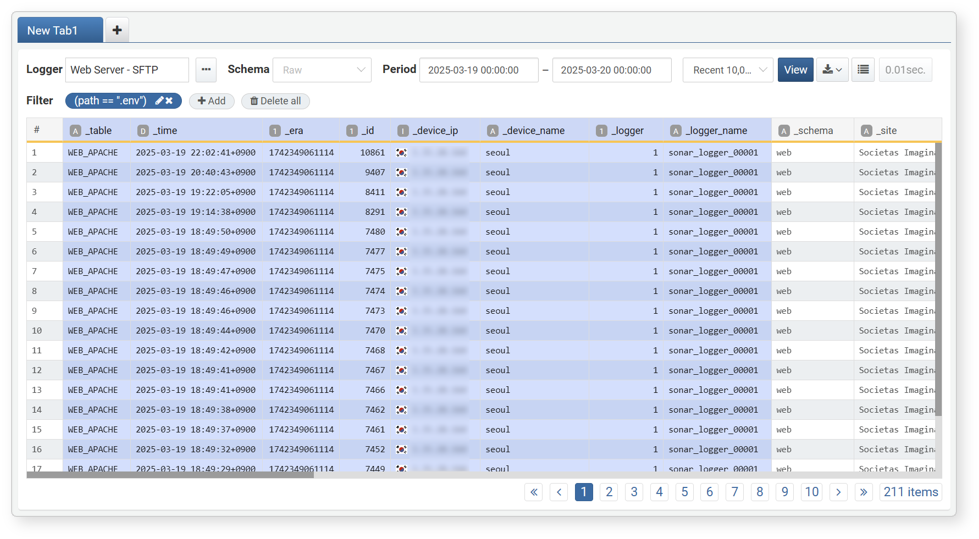
The following is an example of querying raw data after installing the Apache Web Server app.
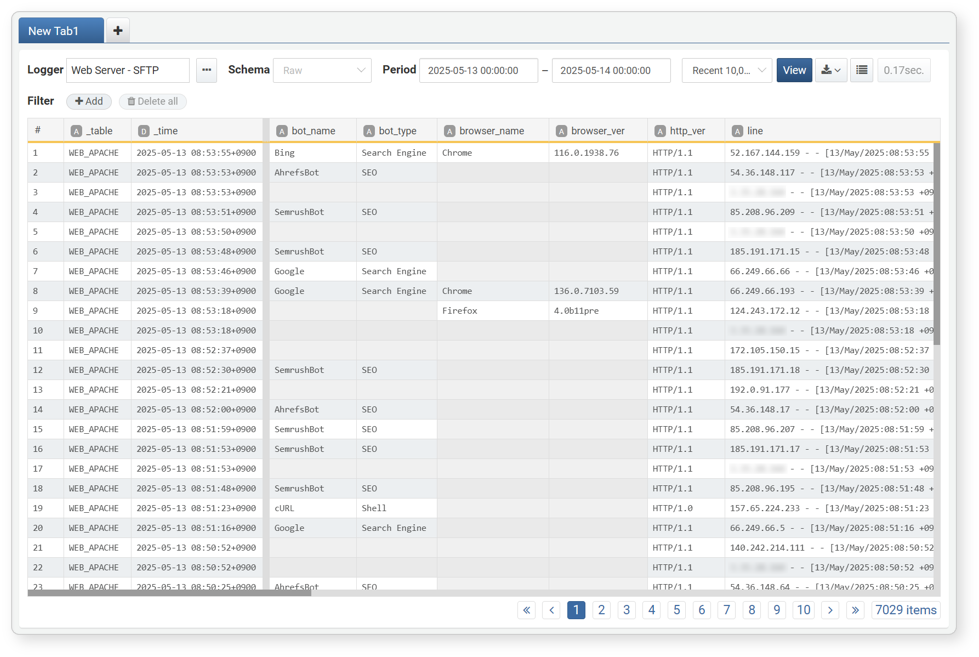
- The bold line between the _time and bot_name fields indicates that some fields are hidden.
- To scroll through the data vertically, use the vertical scroll bar or scroll the mouse wheel.
- To scroll through the data horizontally, use the horizontal scroll bar or hold down the Shift key while scrolling the mouse wheel.
Below is an example of the same data queried using the Web Log schema:
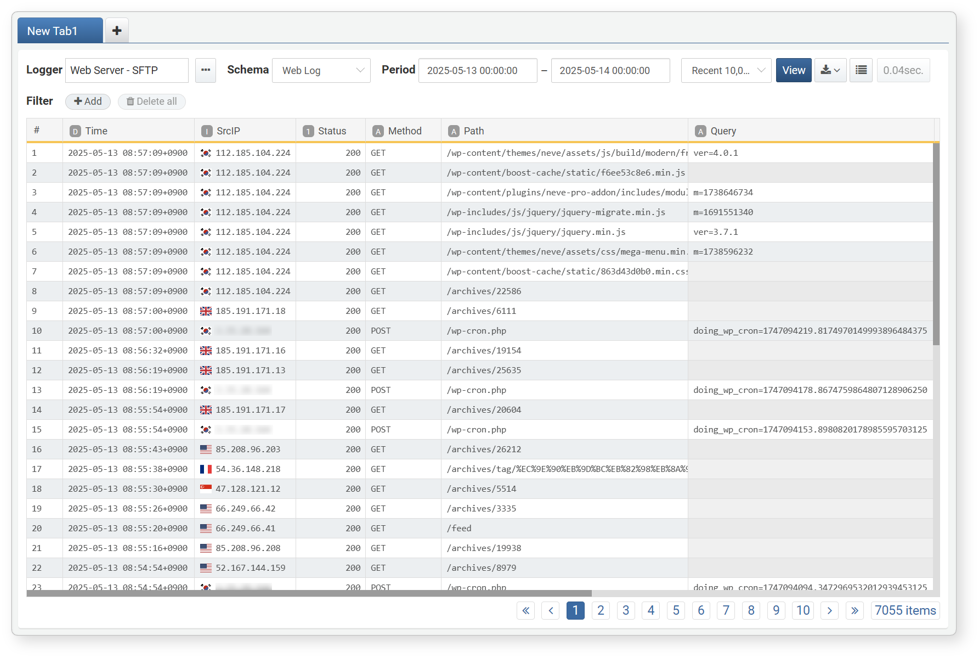
- The log schema is applied, showing normalized logs.
- Field names shown are based on the display names defined in the schema.
Toolbar
The toolbar provides search conditions that allow users to filter logs by time period, logger, or log schema.
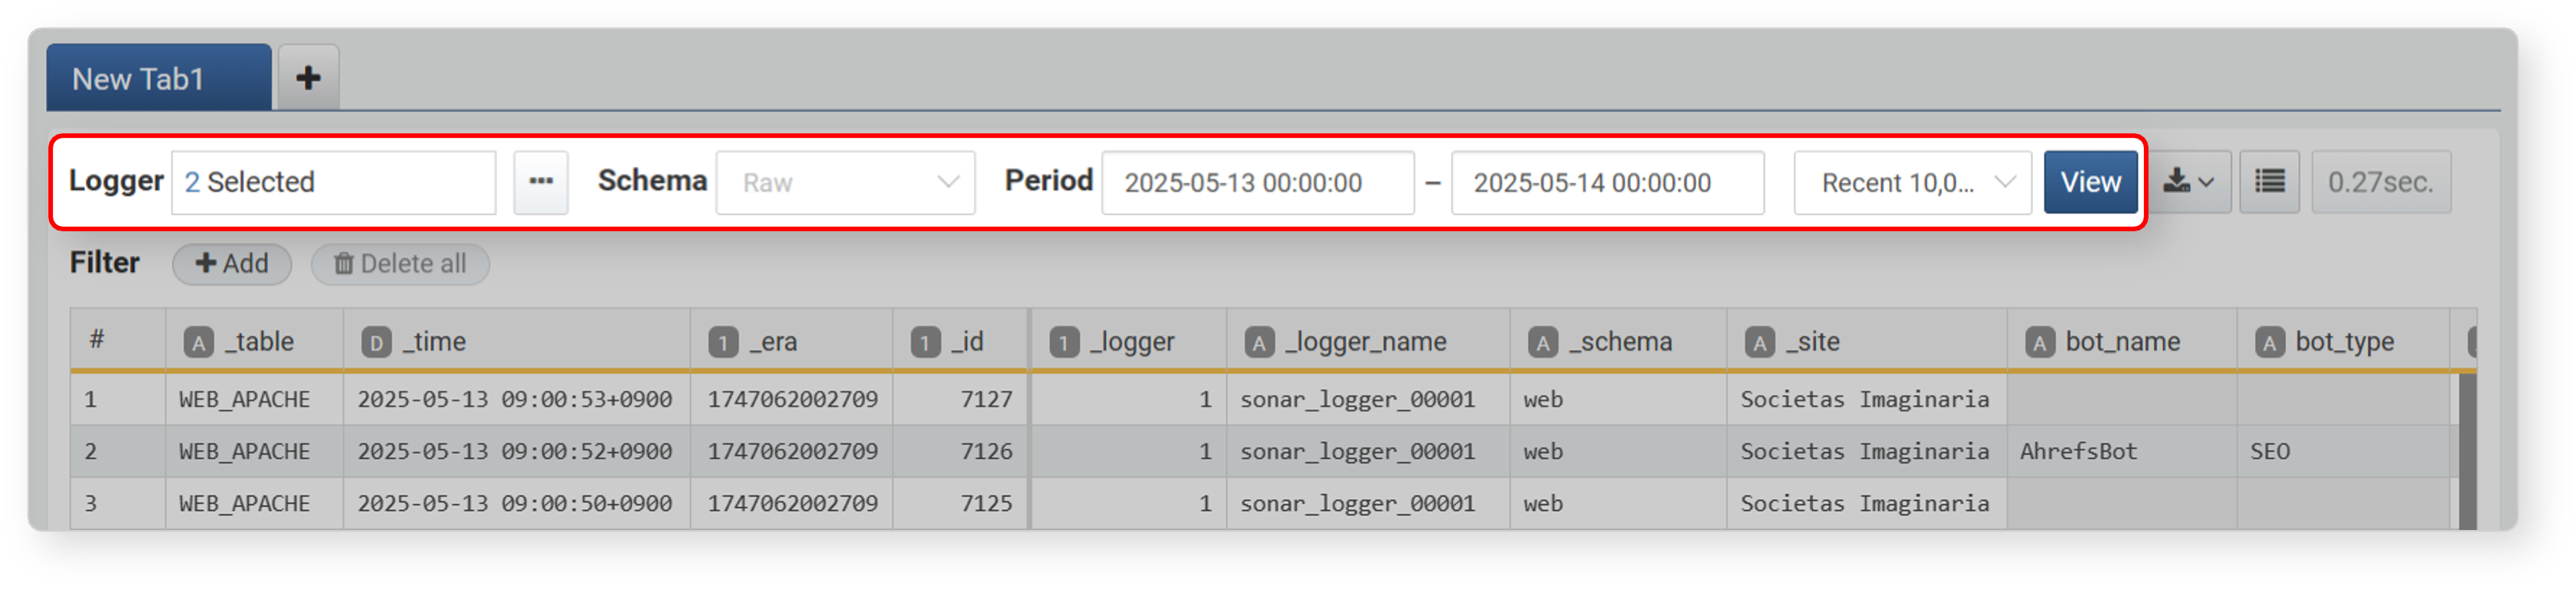
The following search conditions are available in the toolbar:
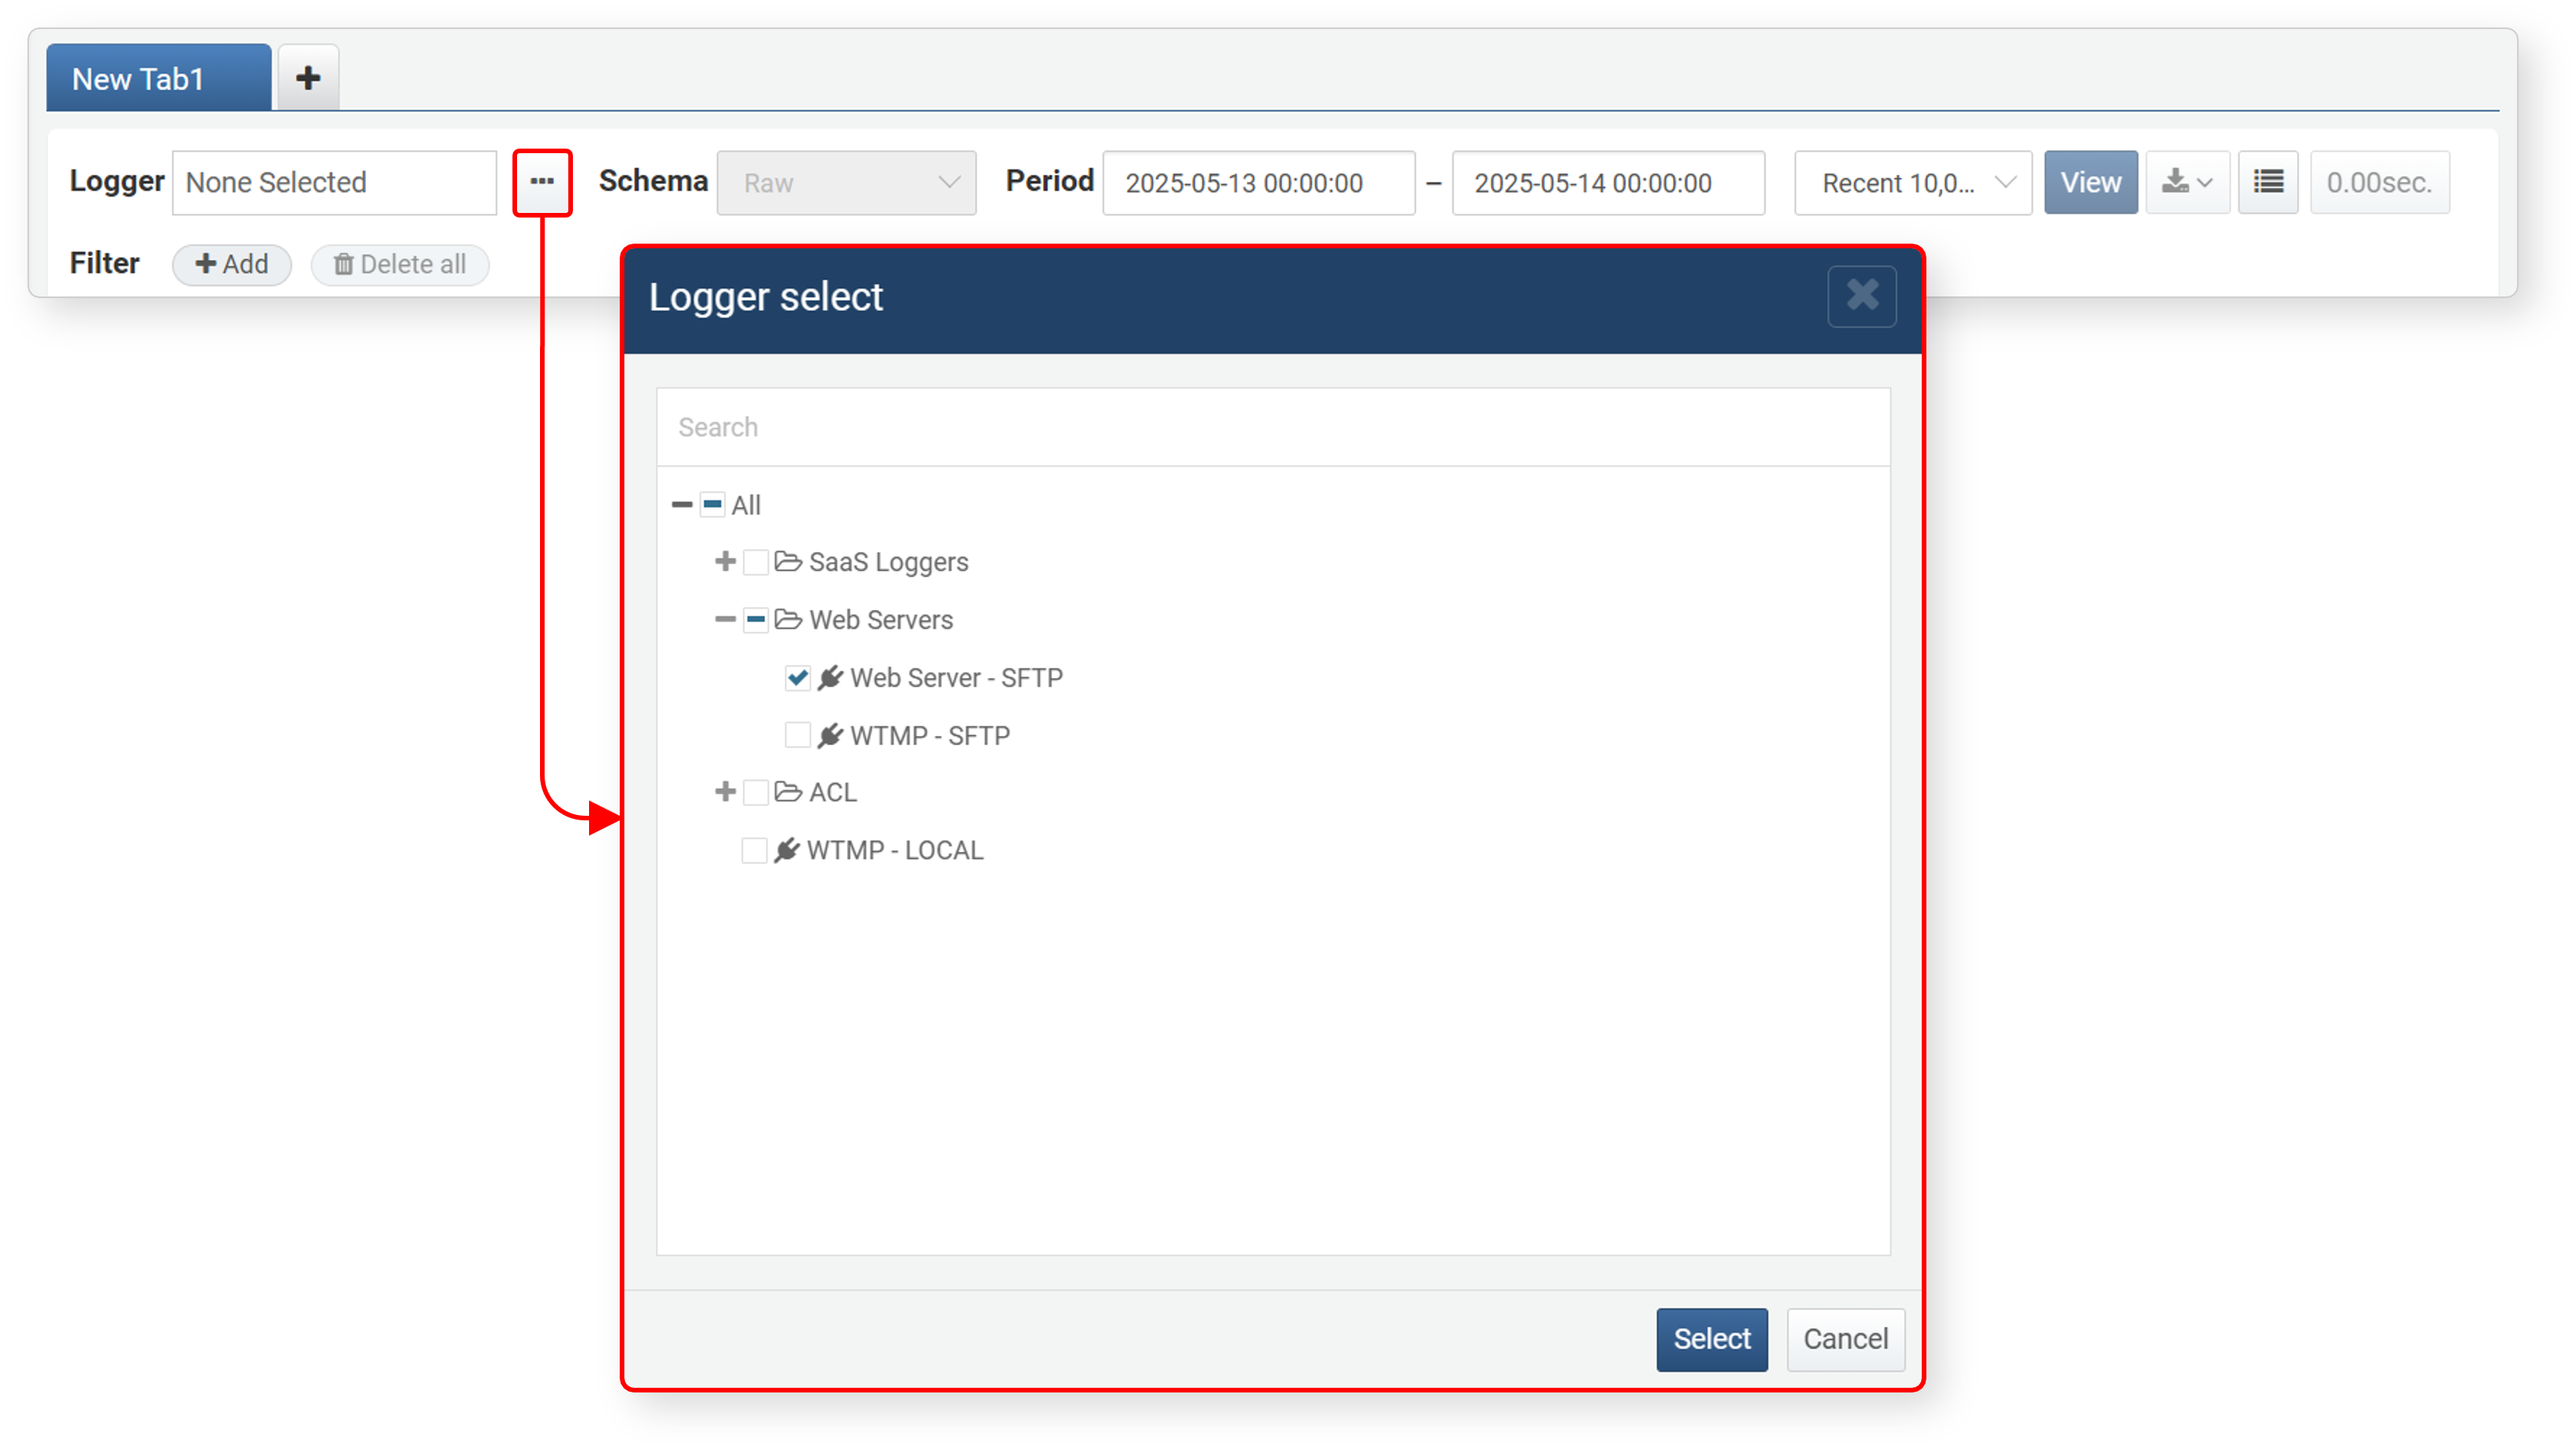
Logger
Selecting at least one logger is required to run a query. The available Schema will change depending on the selected logger(s).
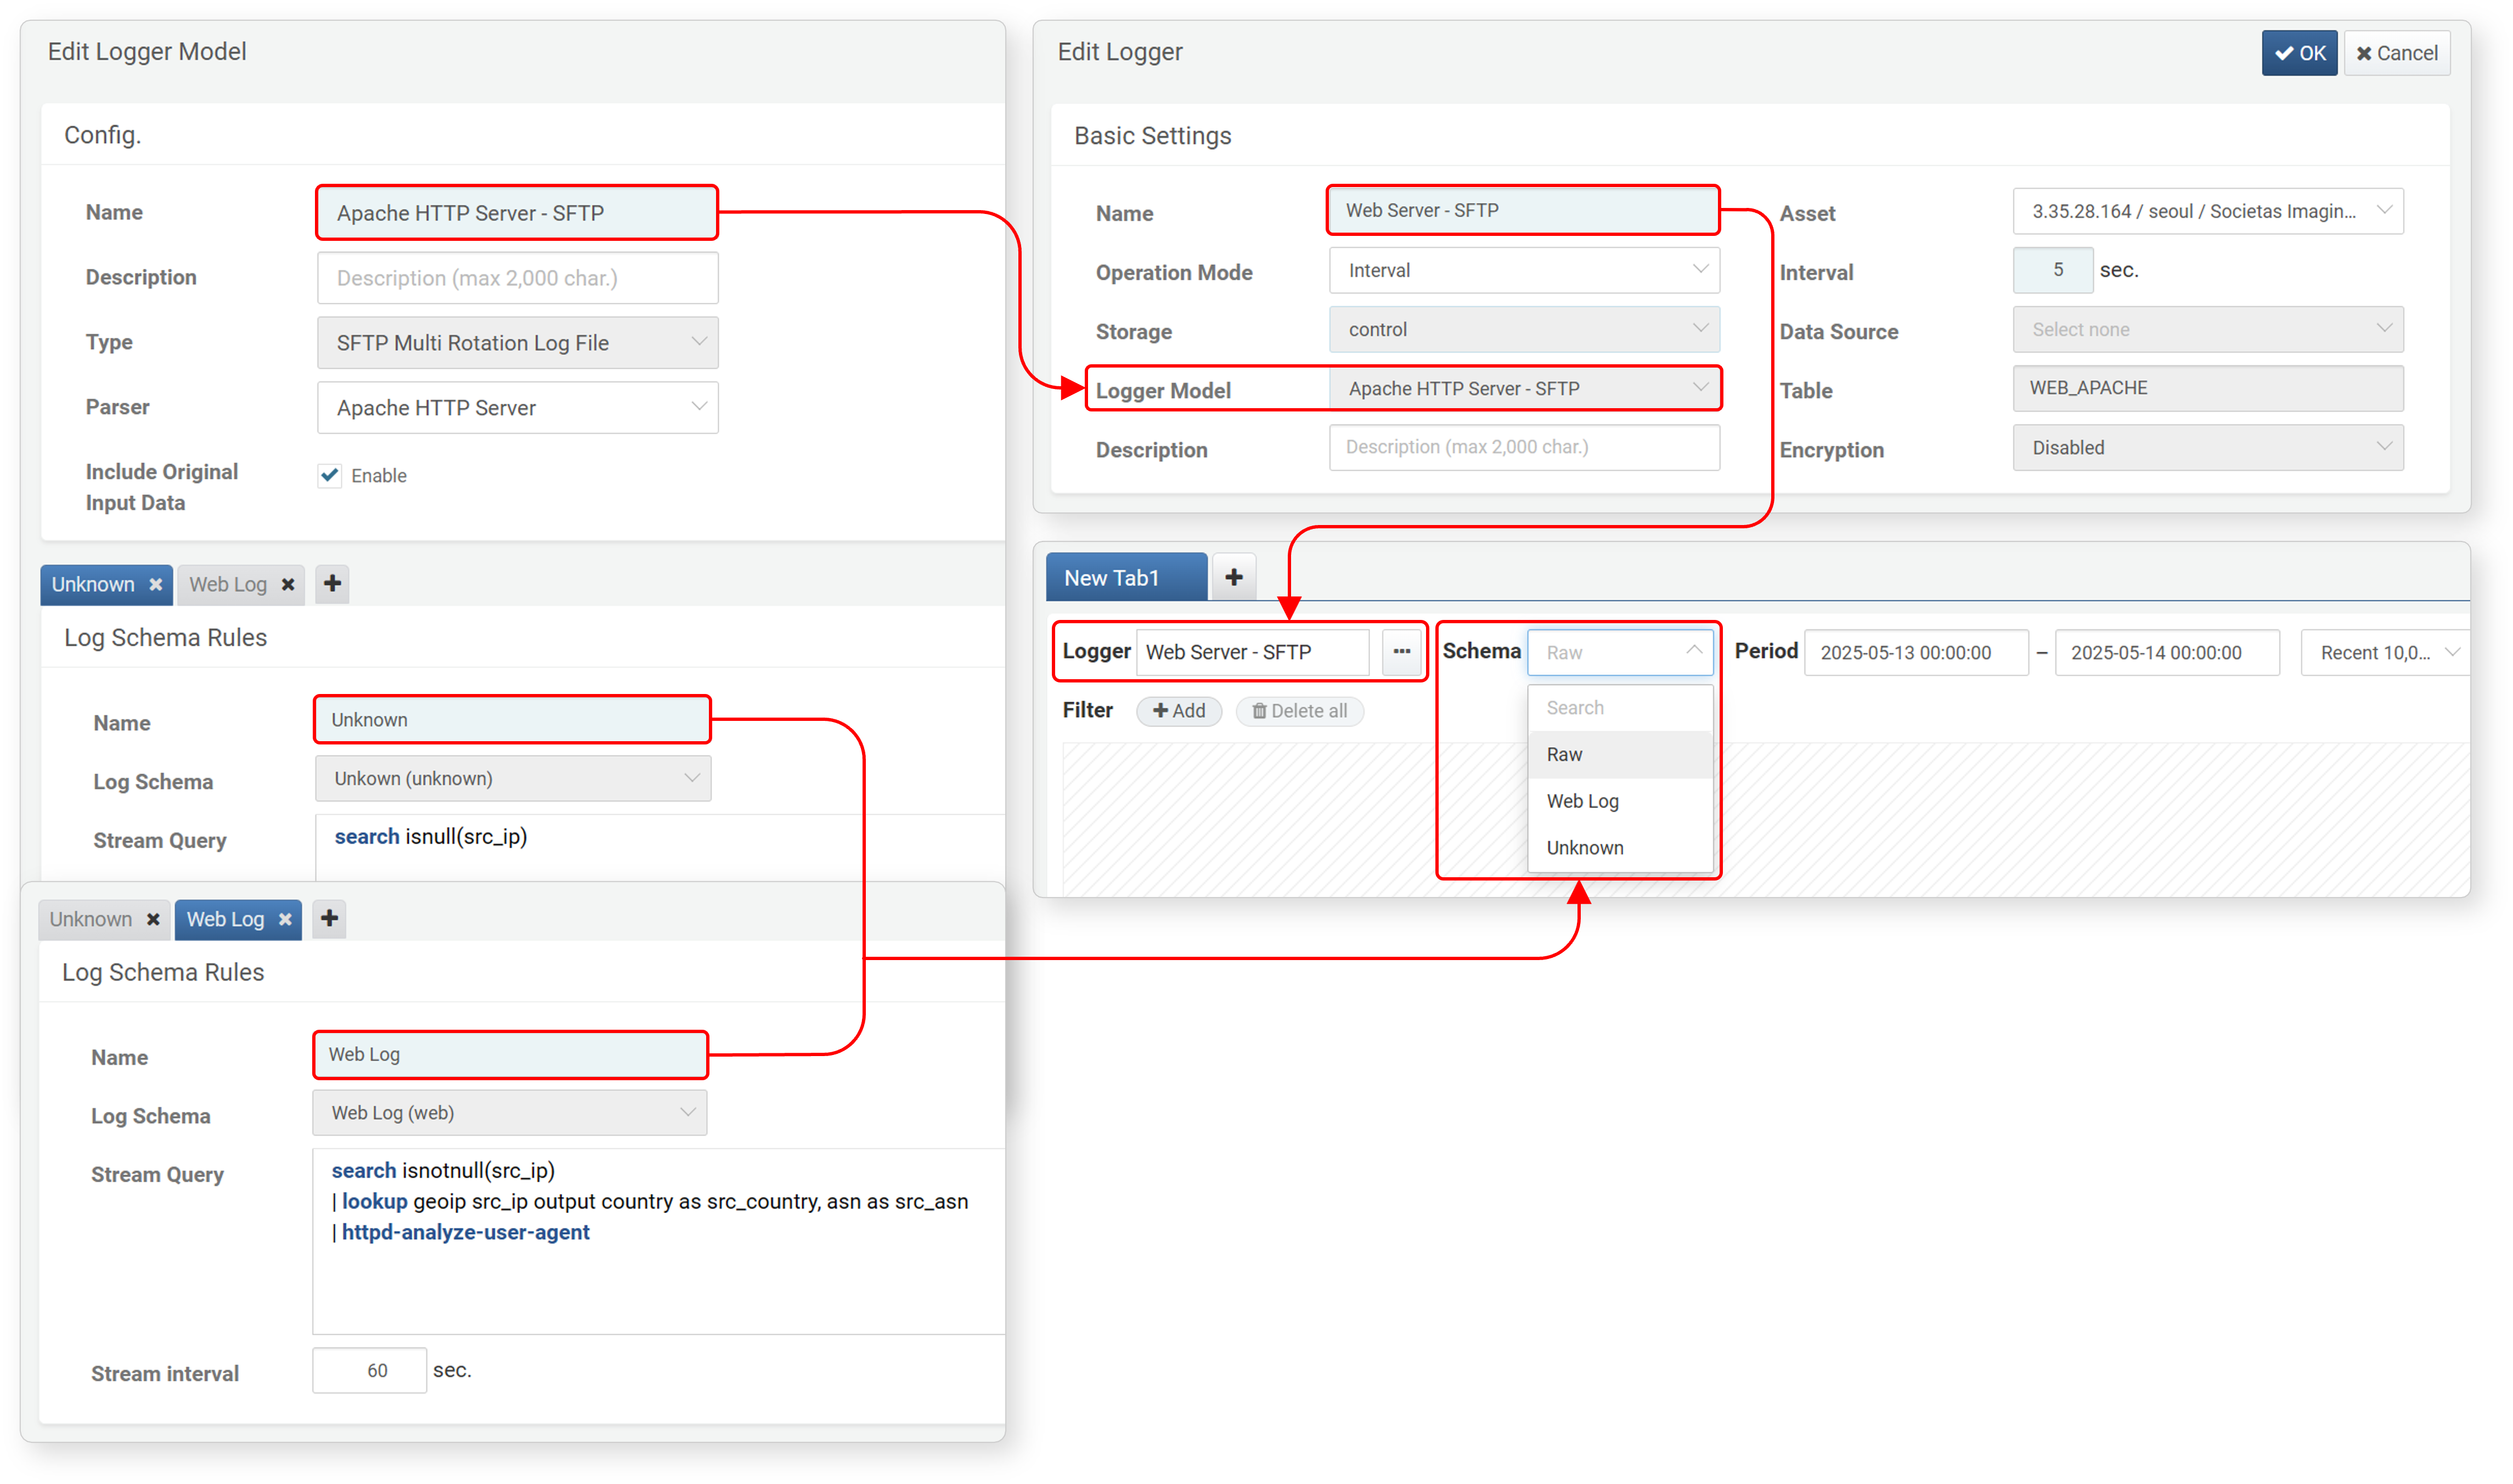
Schema
Select a schema from the schema list (default: Raw). This list includes log schemas defined in the normalization rules of the logger model associated with the selected logger(s).
For example, if you select two loggers associated with different logger models, the schema list will include all schemas referenced in the normalization rules of both models.
The diagram below shows how normalization rules and logger model settings influence available loggers and schemas during log search:
The available fields in your query results will vary depending on the selected schema. Among the selectable options, Raw and Unknown have the following characteristics:
Raw
:Displays the original data, metadata fields, and parser-extracted fields. For metadata fields that can be checked during data retrieval, refer to the output fields of the table command.
- If raw files cannot be retrieved, only parser-extracted fields will be shown.
- For text-based raw data, see the
linefield; for JSON-based input, refer to theparamsfield.
- Unknown
- Select this option to view data that could not be normalized due to the absence of a matching rule. The Unknown schema is built-in starting from version 4.0.2409.0.
Period
Specify the time range for the log query. Depending on whether the log was parsed, the relevant timestamp may represent either the time the log was collected into the table or the time the event occurred in the log record. (Default: 00:00 of the current day to 00:00 of the next day; the next day's 00:00 is excluded.)
- You can enter the time directly or use the time picker that appears when clicking the input field.
- For parsed logs, the _time field stores the timestamp extracted from the original data.
- For unparsed logs (logs from models without a parser), the _time field stores the collection time, so search by collection time to get accurate results.
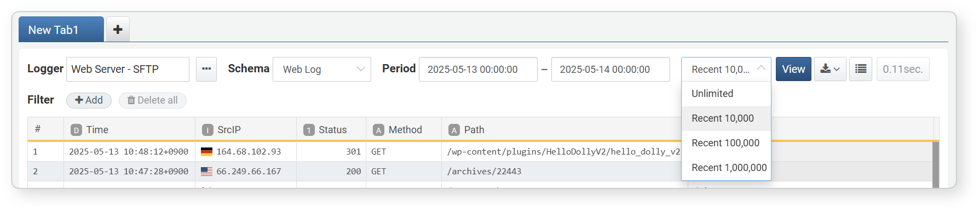
Maximum Records
Specify the maximum number of log records to retrieve. If log volume is high, retrieving all data at once may take a long time. To ensure performance, it's recommended to limit the result size (default: 10,000 records). You can select from Unlimited, Recent 10,000, Recent 100,000, or Recent 1,000,000 records.
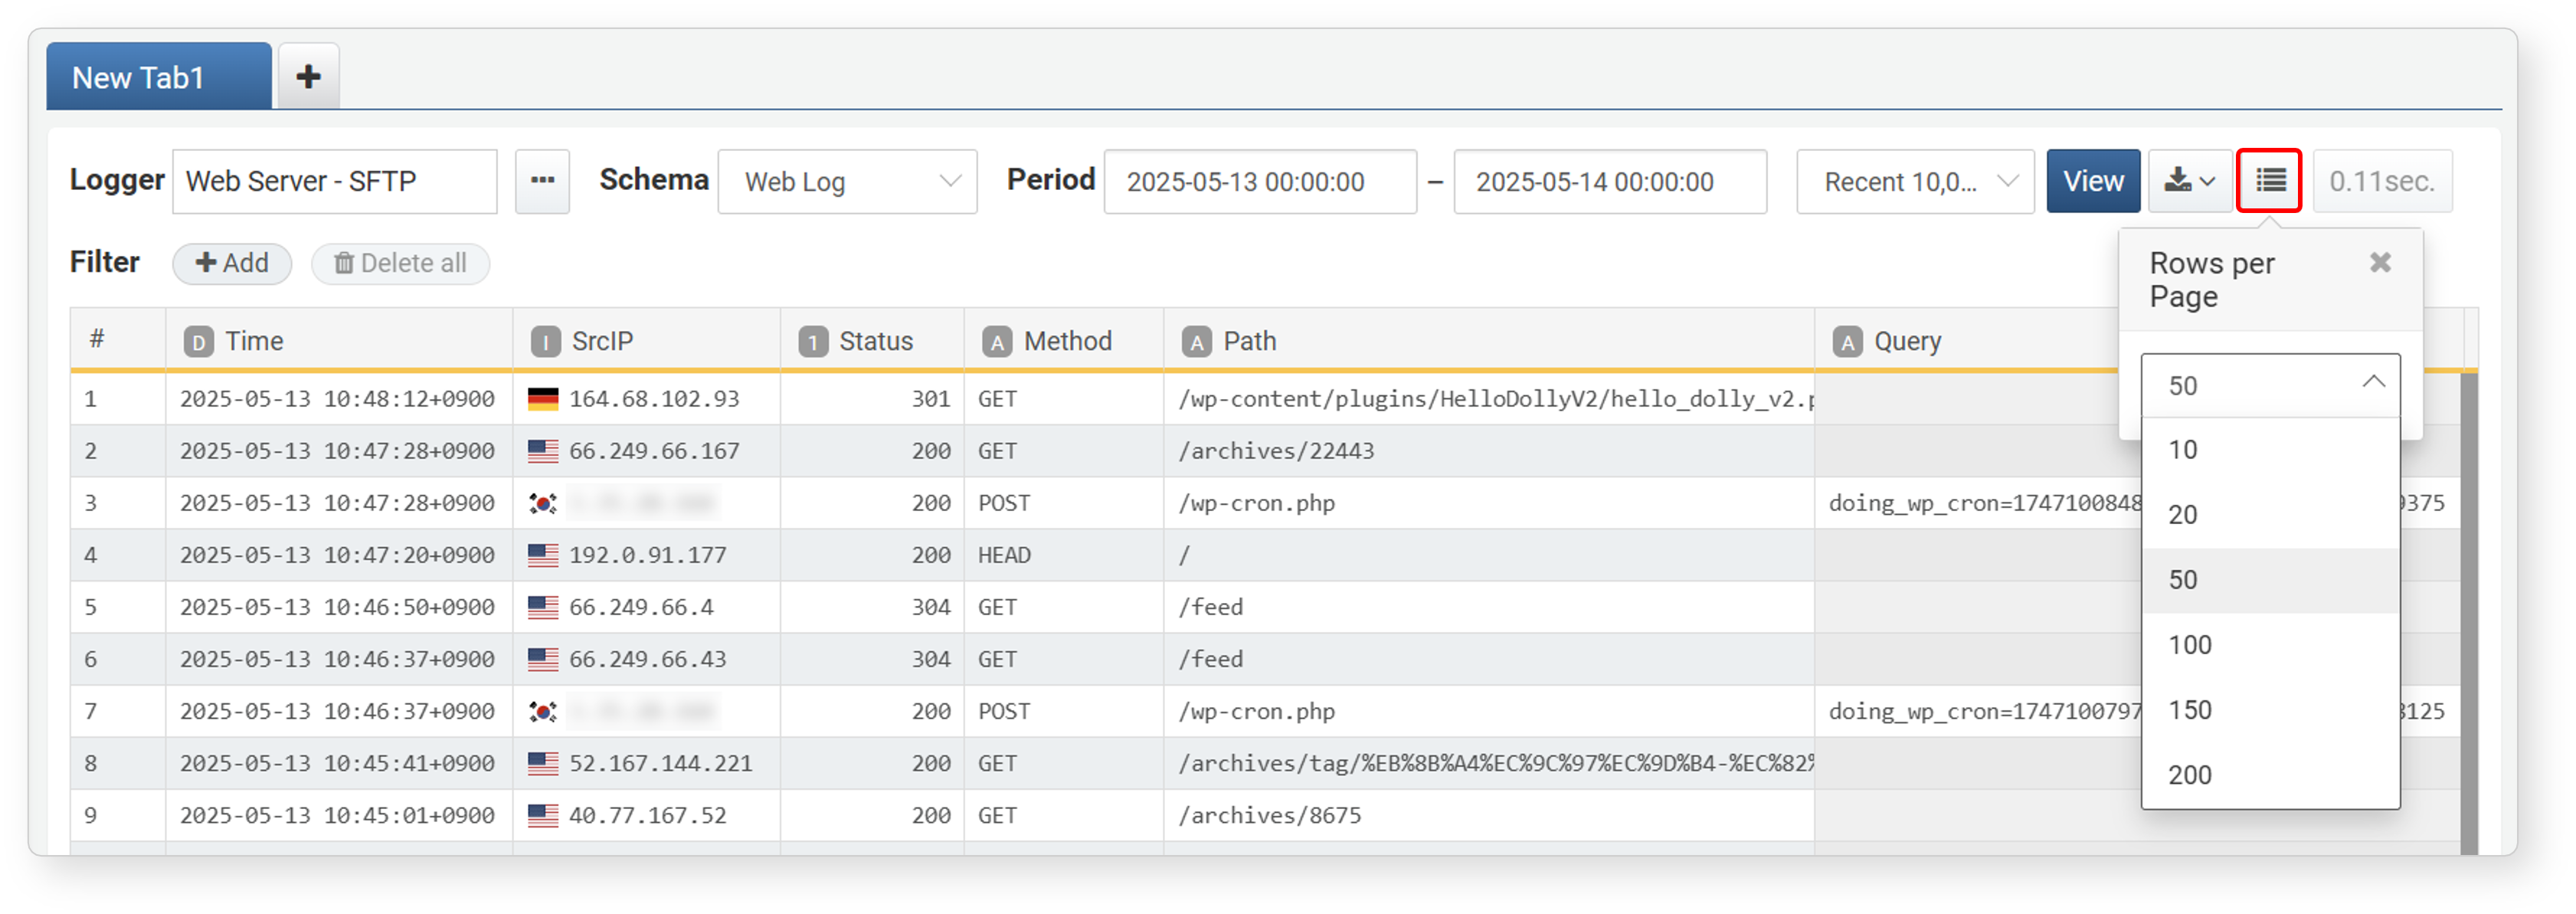
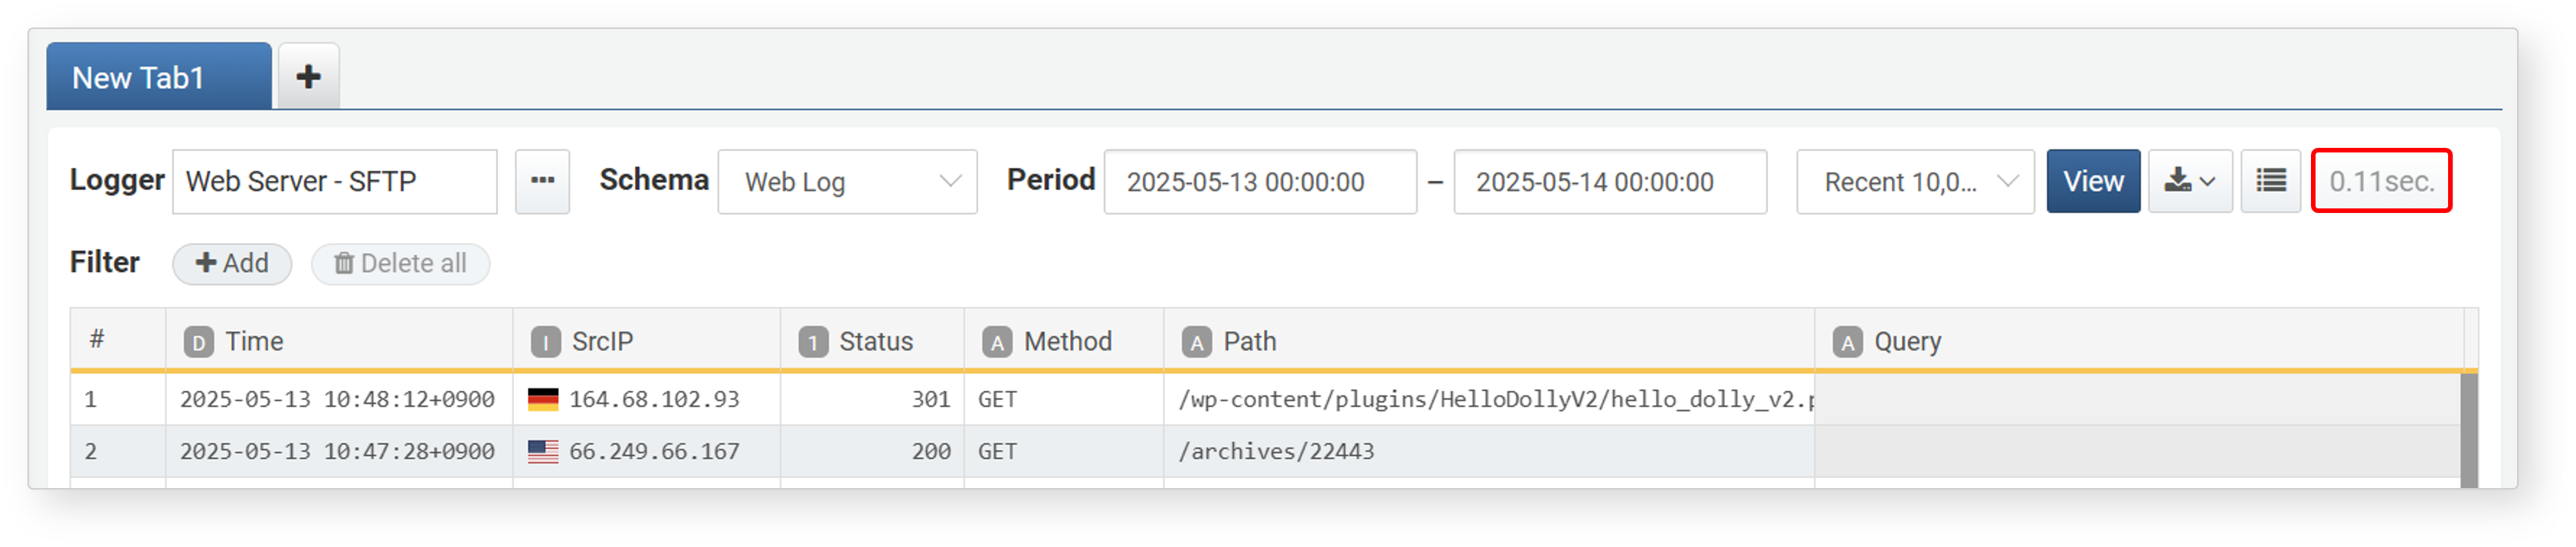
Rows per Page & Query Time
Log search results are paginated, with 50 records displayed per page by default. You can change the number of rows per page using the corresponding option in the toolbar.
After the log search is complete, you can view the time it took to complete the query:
Filters
Filters allow you to narrow down logs efficiently based on specific conditions. Filters compare a field's value against a specified value and return only the data where the field values match the criteria.
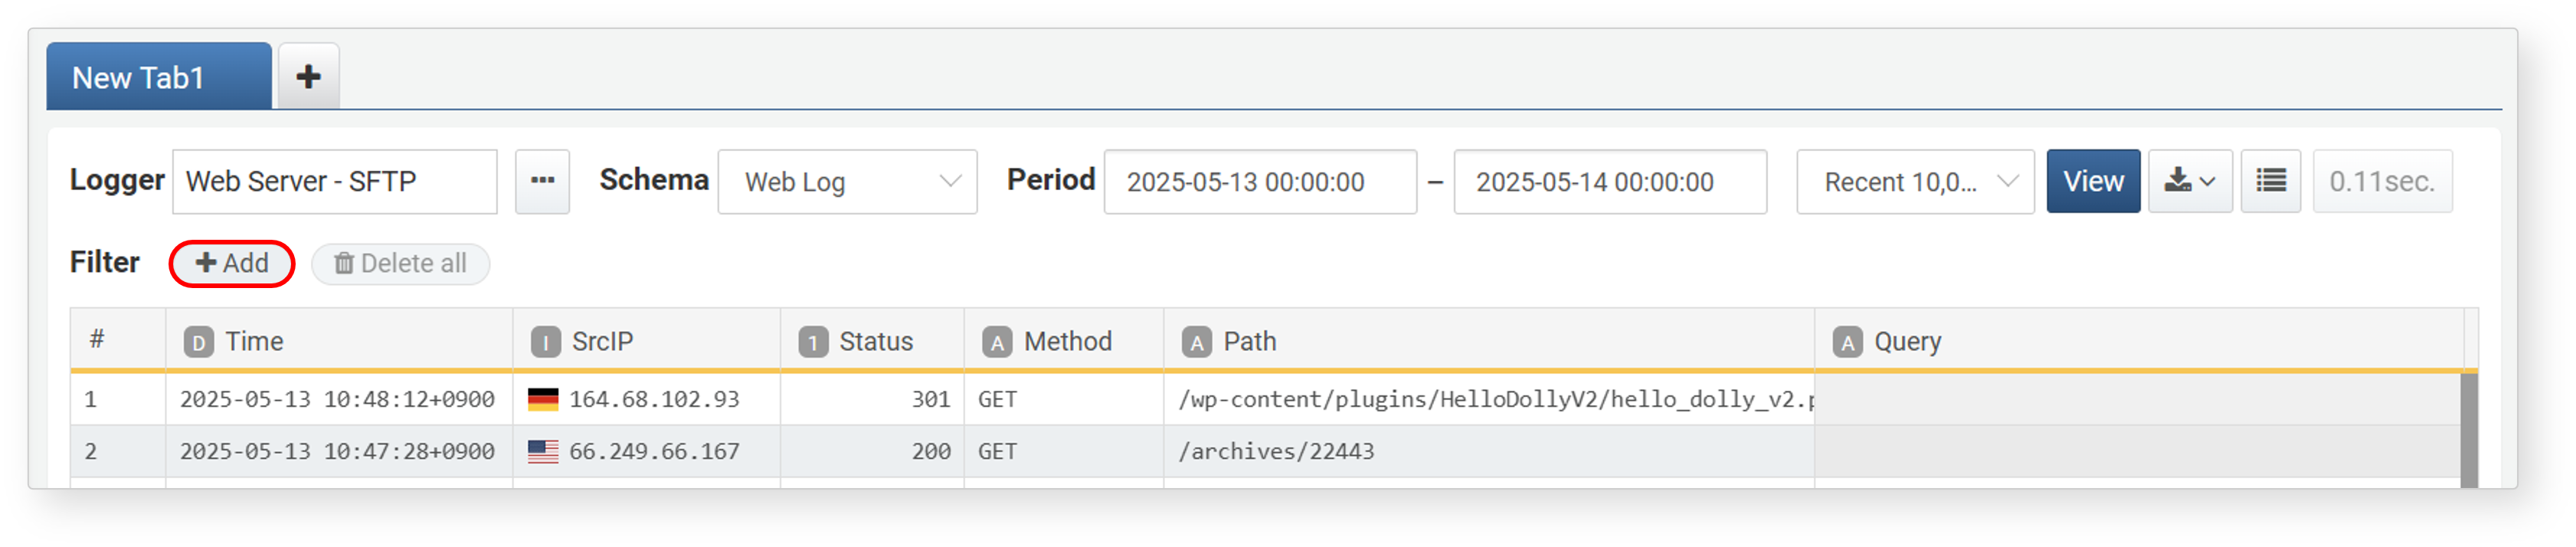
Method 1: Add Filter via Toolbar
To add a filter to a specific field:
-
After running a log search, click Add under the Filter section below the toolbar.
-
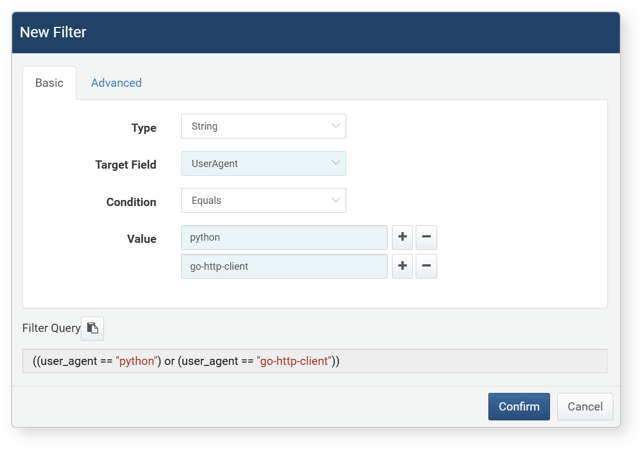
In the Add Filter dialog, set each item in the Basic or Advanced tab, then click OK. The filter will be translated into a Logpresso query expression and displayed in the Filter Query section at the bottom of the dialog.
-
Type: Choose the data type of the field to filter (String, Integer, Date, IP Address, IP Range, Expression). The available fields will change depending on the selected type.
-
Target Field: Select the field you want to filter from the list of fields in the query result.
-
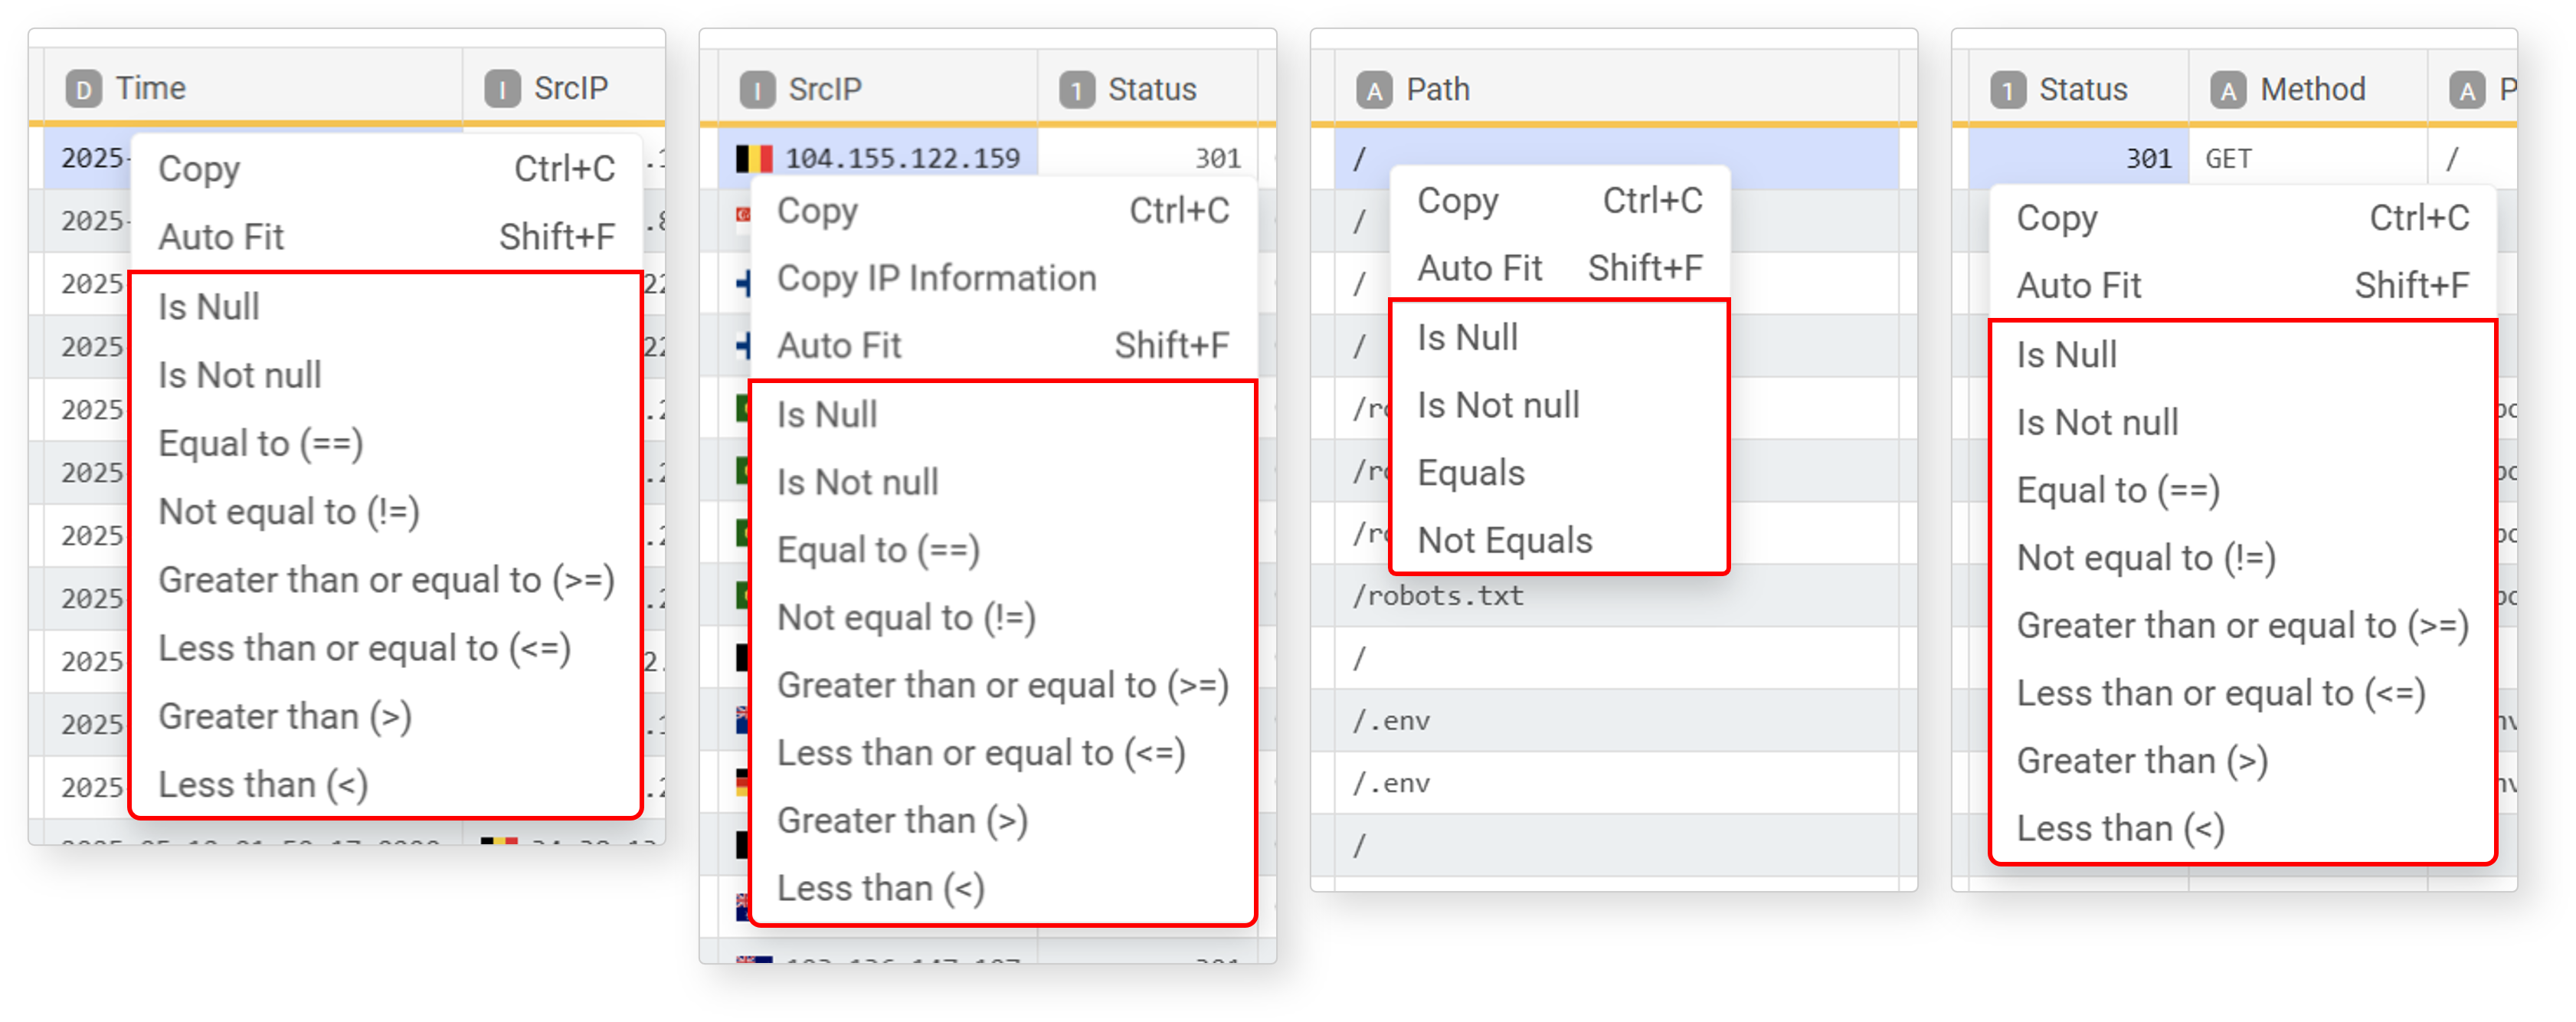
Condition: Choose a comparison operator to apply between the field and the input value. The available operators vary by type:
Condition String Integer Date IP Address IP Address (Range) Equals O Not Equals O Equal to ( ==)O O O O Not equal to ( !=)O O O O Greater than or equal to ( >=)O O O Less than or equal to ( <=)O O O Greater than ( >)O O O Less than ( <)O O O -
Value: Enter the comparison value.
- String comparisons are case-insensitive.
- Use the + or - buttons to add or remove multiple comparison values.
-
Filter Query: Displays the auto-generated Logpresso query expression. Click the
 icon to copy the query.
NoteIf you select "Expression" as the type, you can manually enter a Logpresso query expression.
In the Advanced tab,you can use logical operators like AND and OR to combine filters:
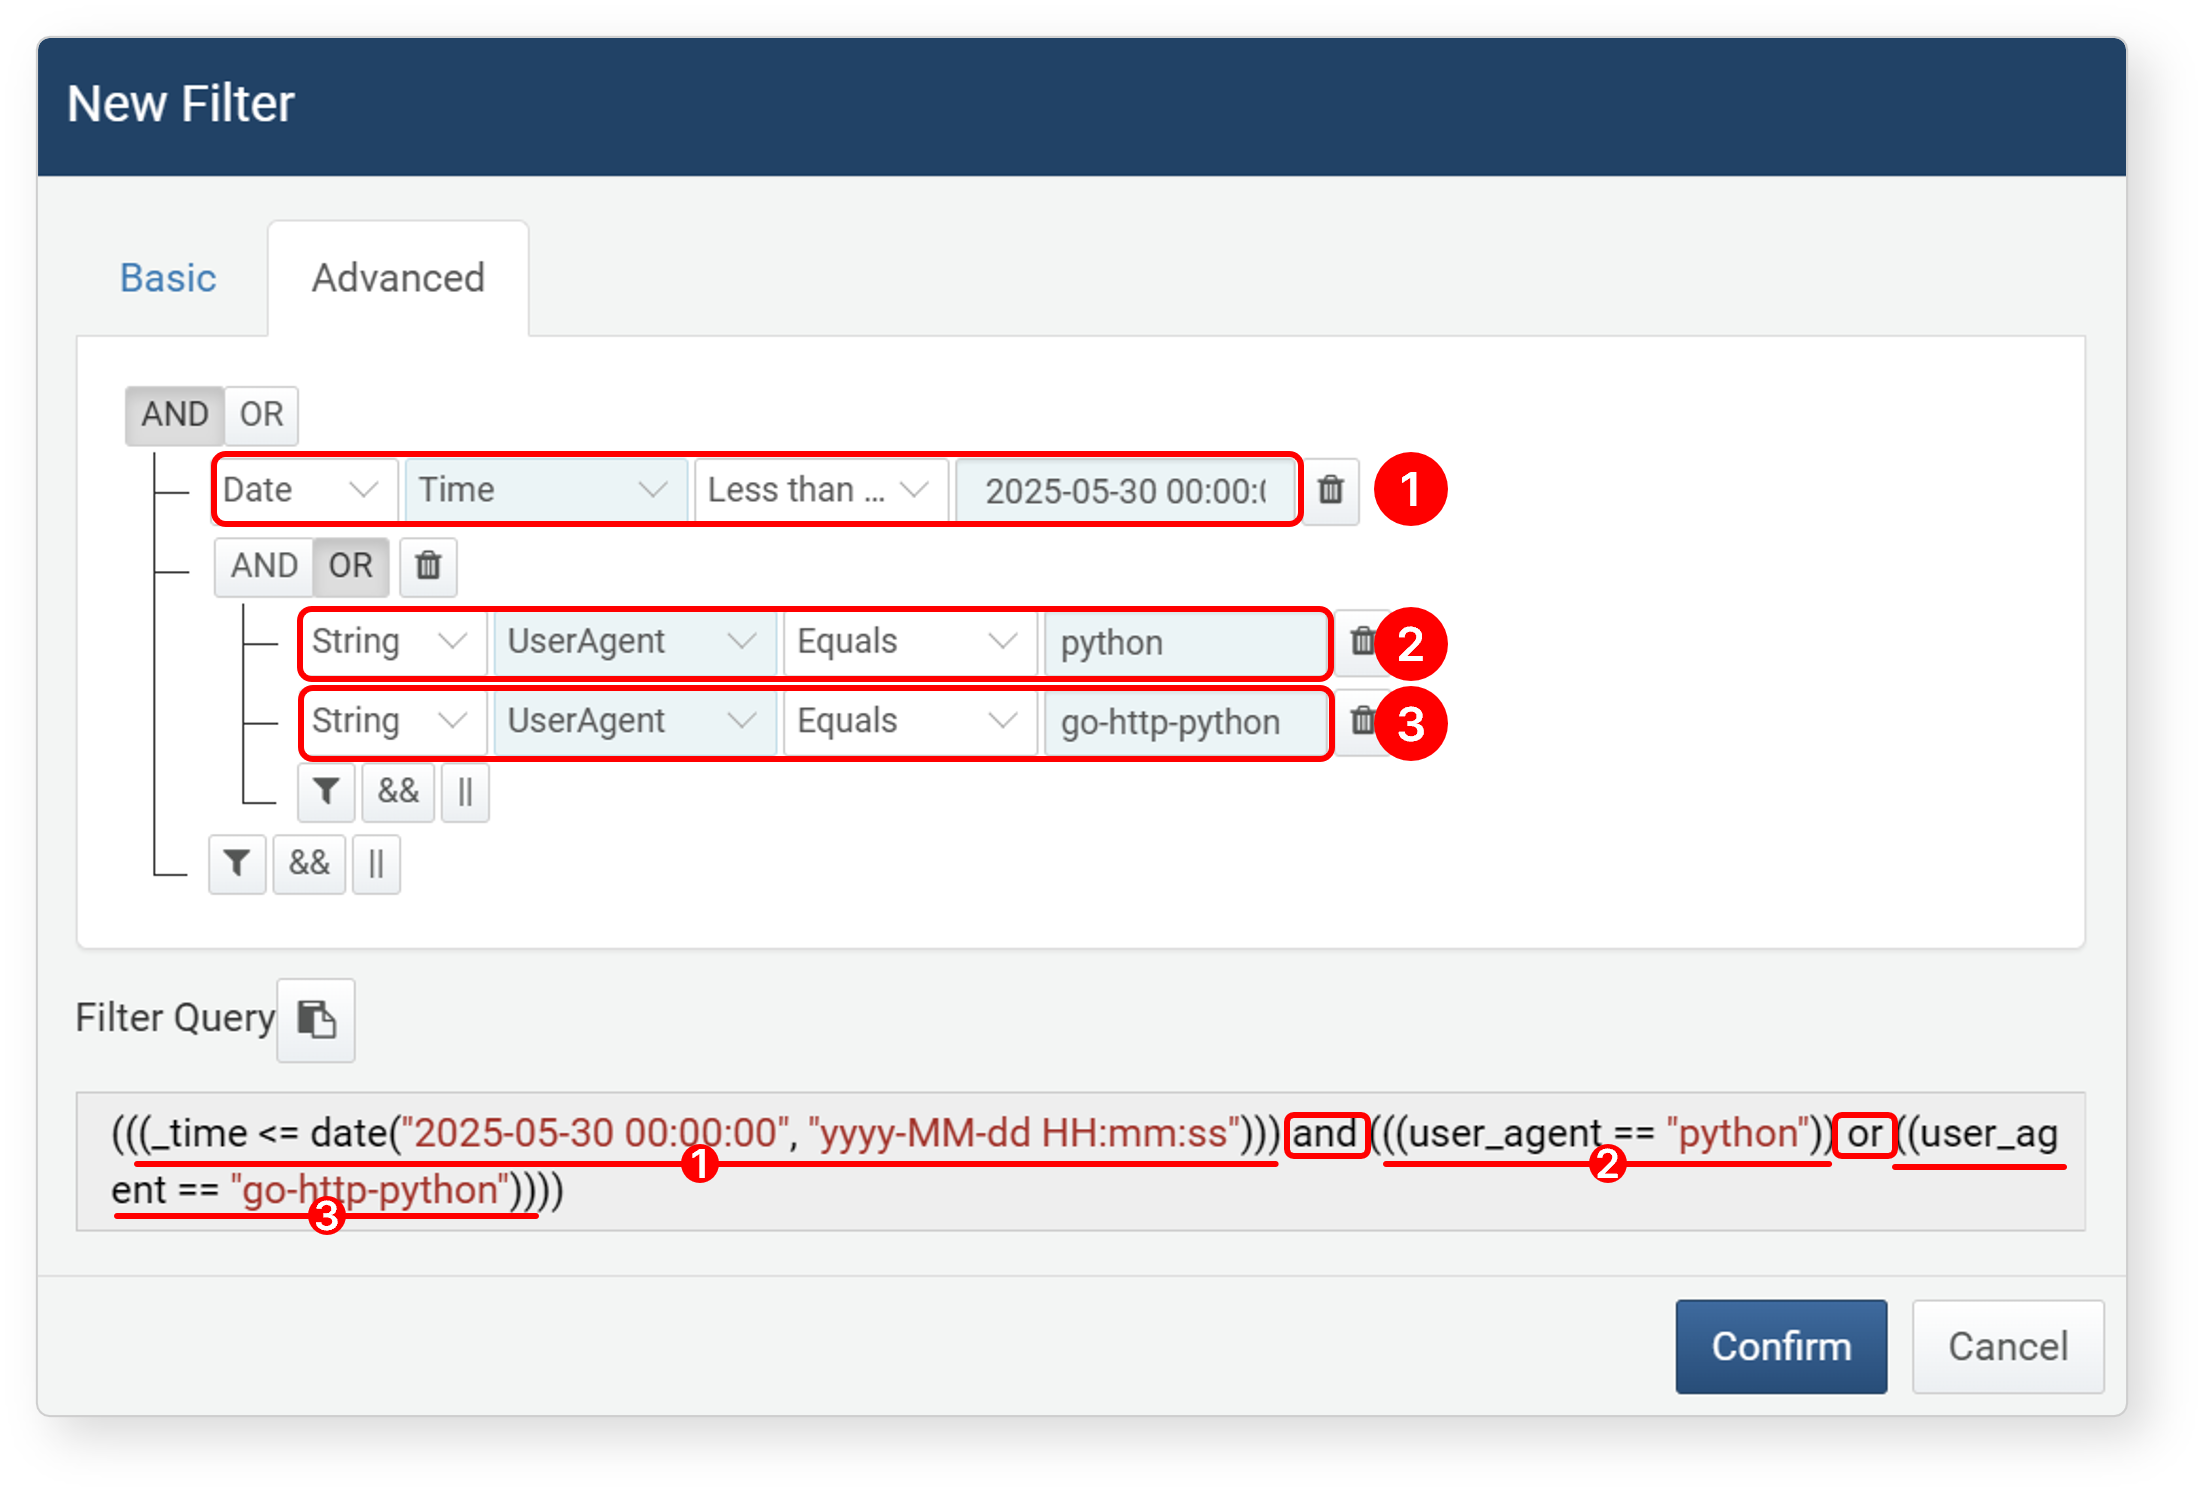
- Click AND or OR to combine conditions.
- Click
 button to add a grouped expression (up to 3 levels deep).
 - Click
&&(AND) or||(OR) to add a grouped expression (up to 3 levels deep). - Click Remove All to clear all filters.
-
The following is an example where a filter(user_agent == "python") applied to the user_agent field to find values containing python.
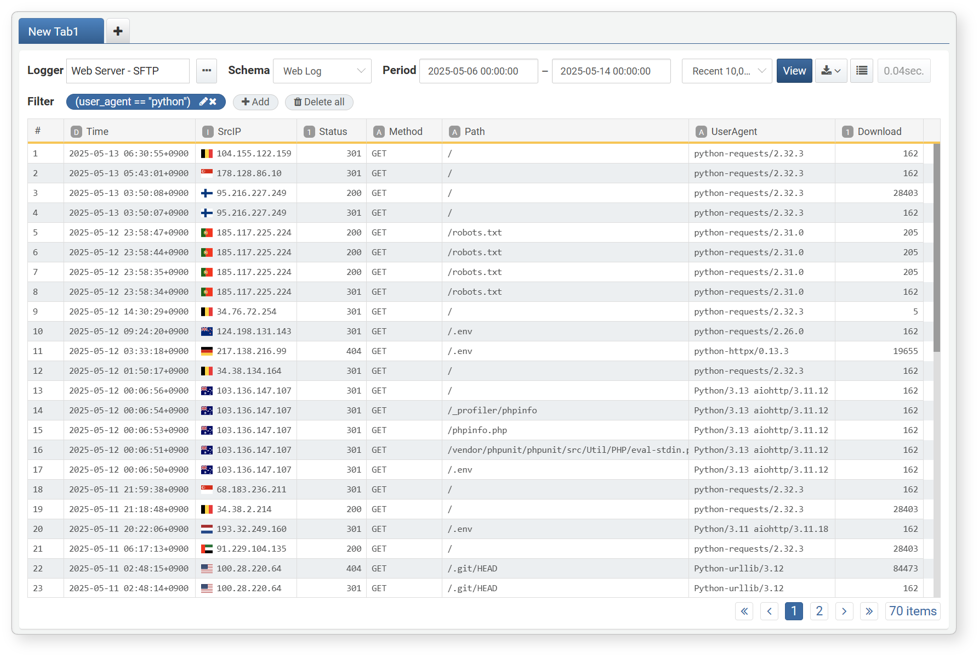
- Click the pencil icon to edit a filter.
- Click X on a filter to remove it.
- You can add multiple filters. Multiple filters are combined with AND.
- Click **Remove All to clear all filters.
Method 2: Add Filter from Field Value
You can add filters directly from a field value in the search result:
-
Right-click on the field value you want to filter.
-
In the context menu, select a filter condition. Available options may vary depending on the data type.
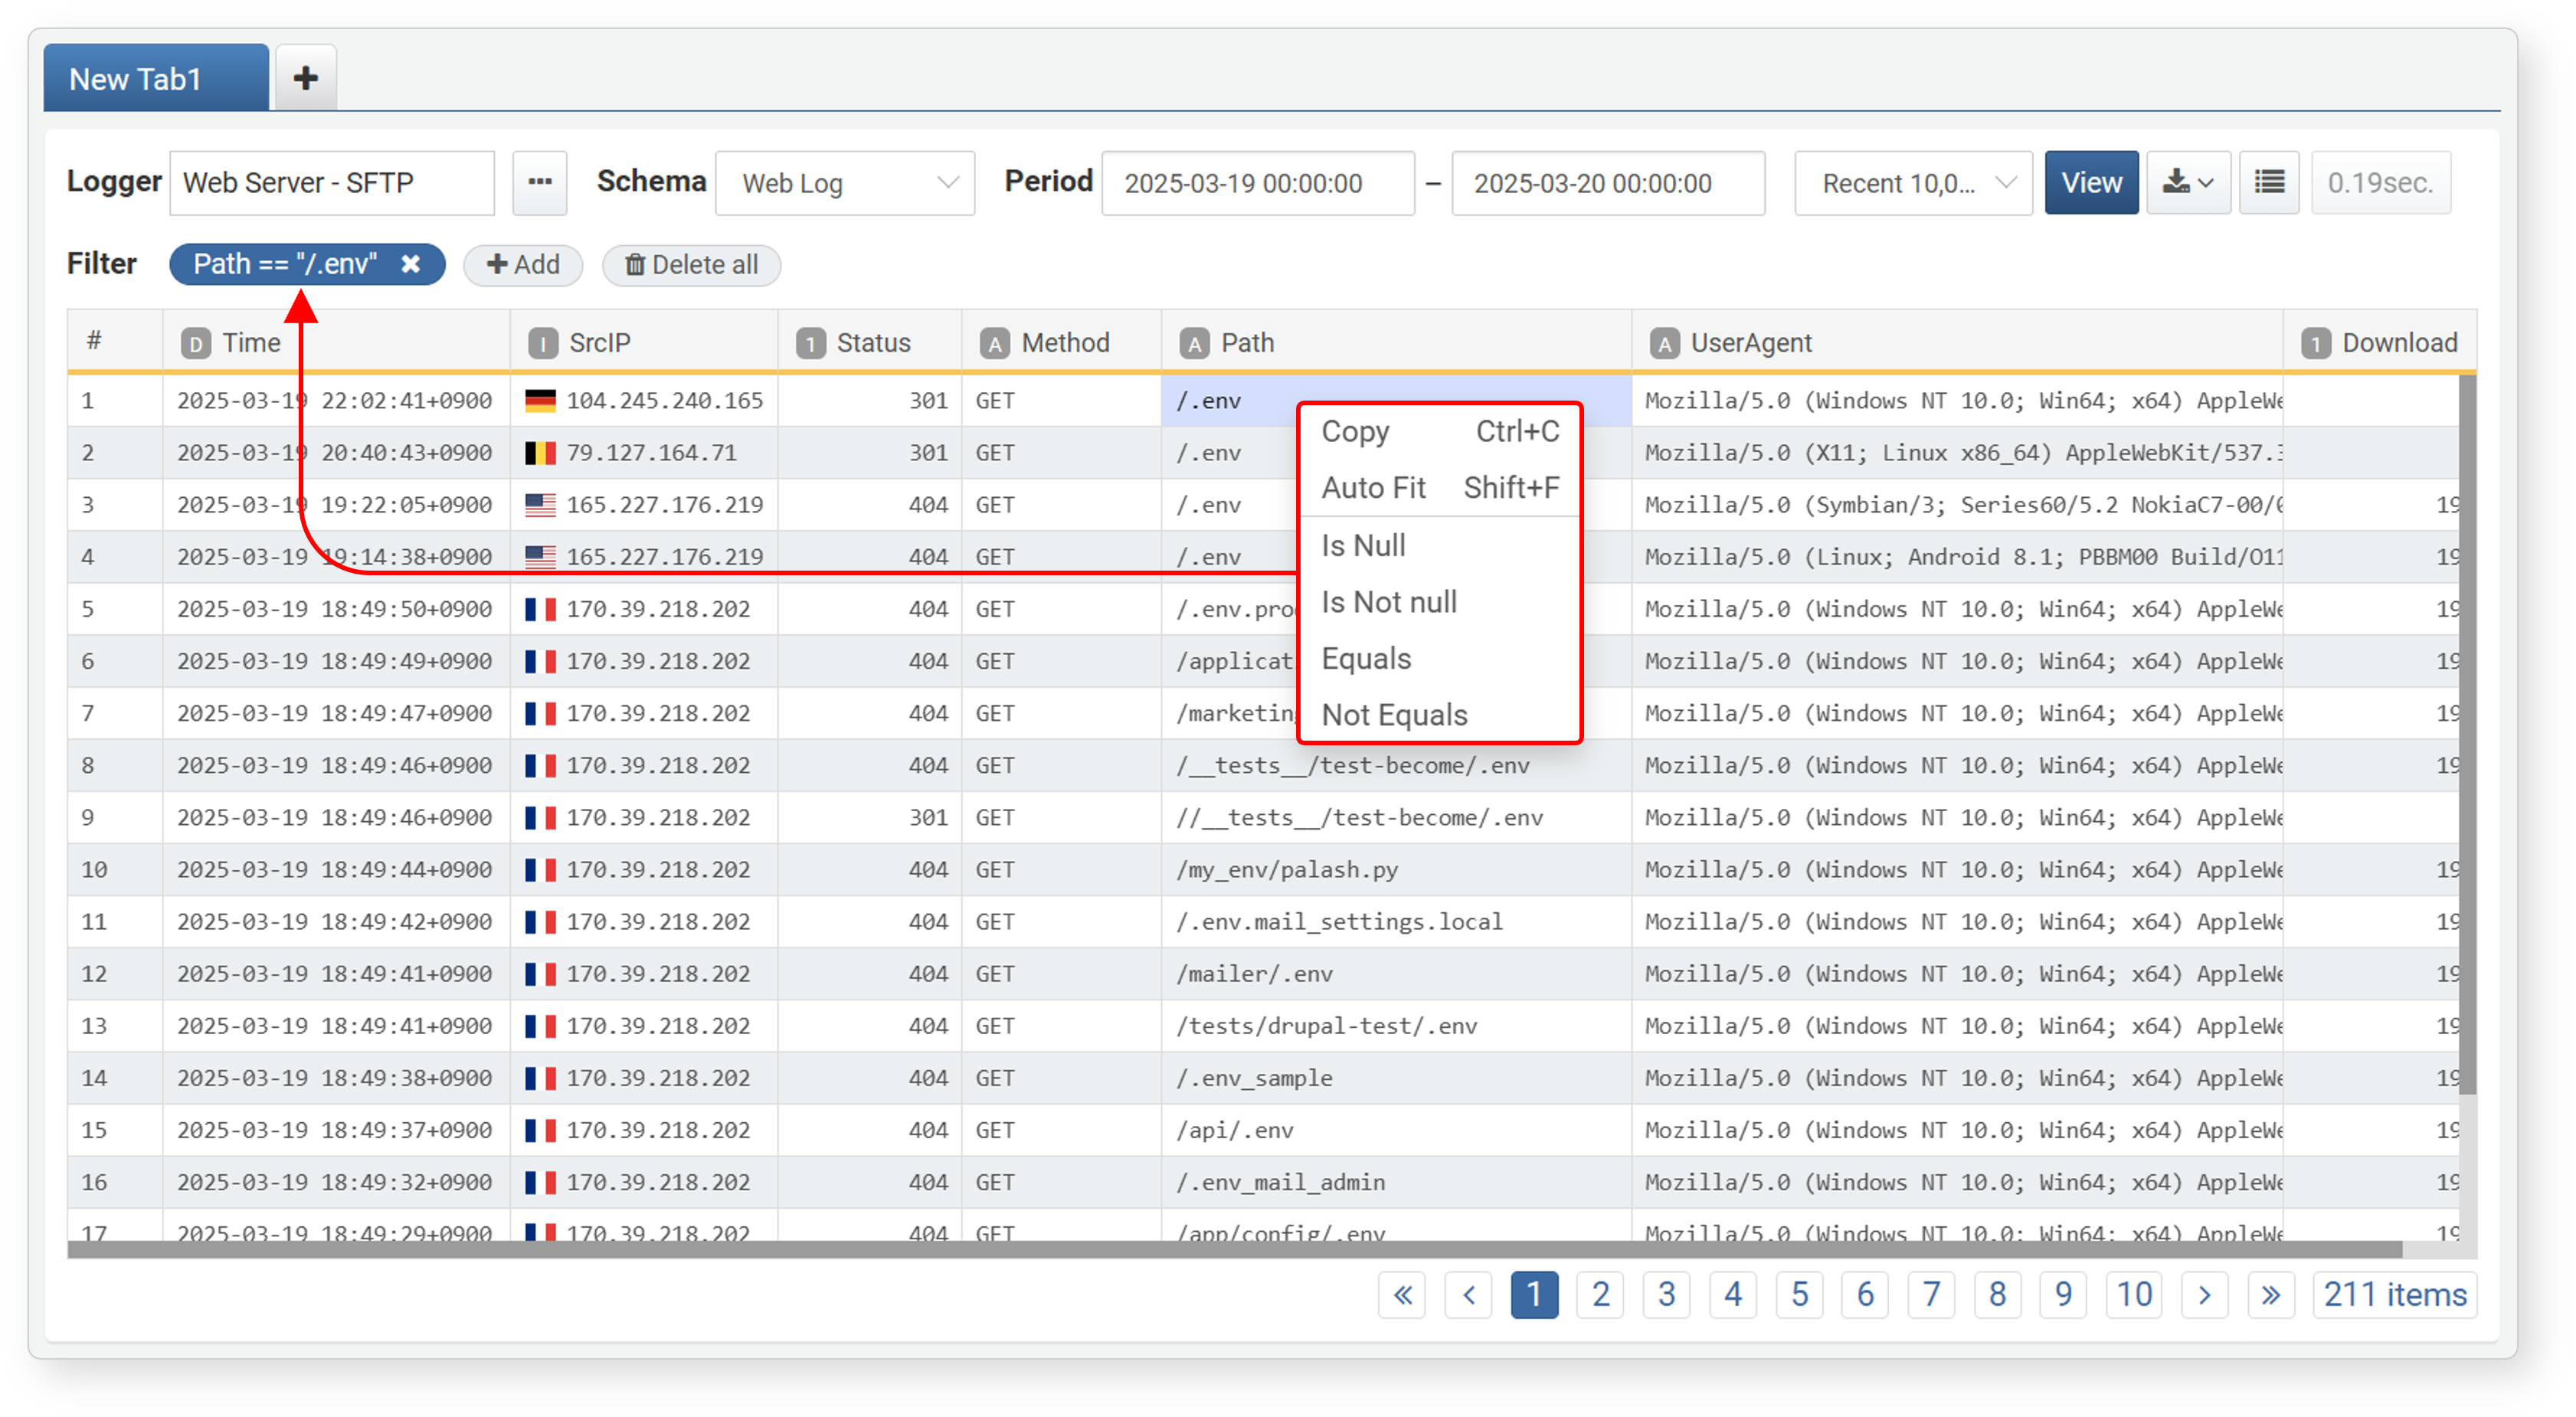
The following is an example of filtering for values that include /.env in the path field of a normalized web log
Edit Fields
You can sort and manage fields in the log data. Right-click a field or click the dropdown arrow that appears on hover to access the options menu.
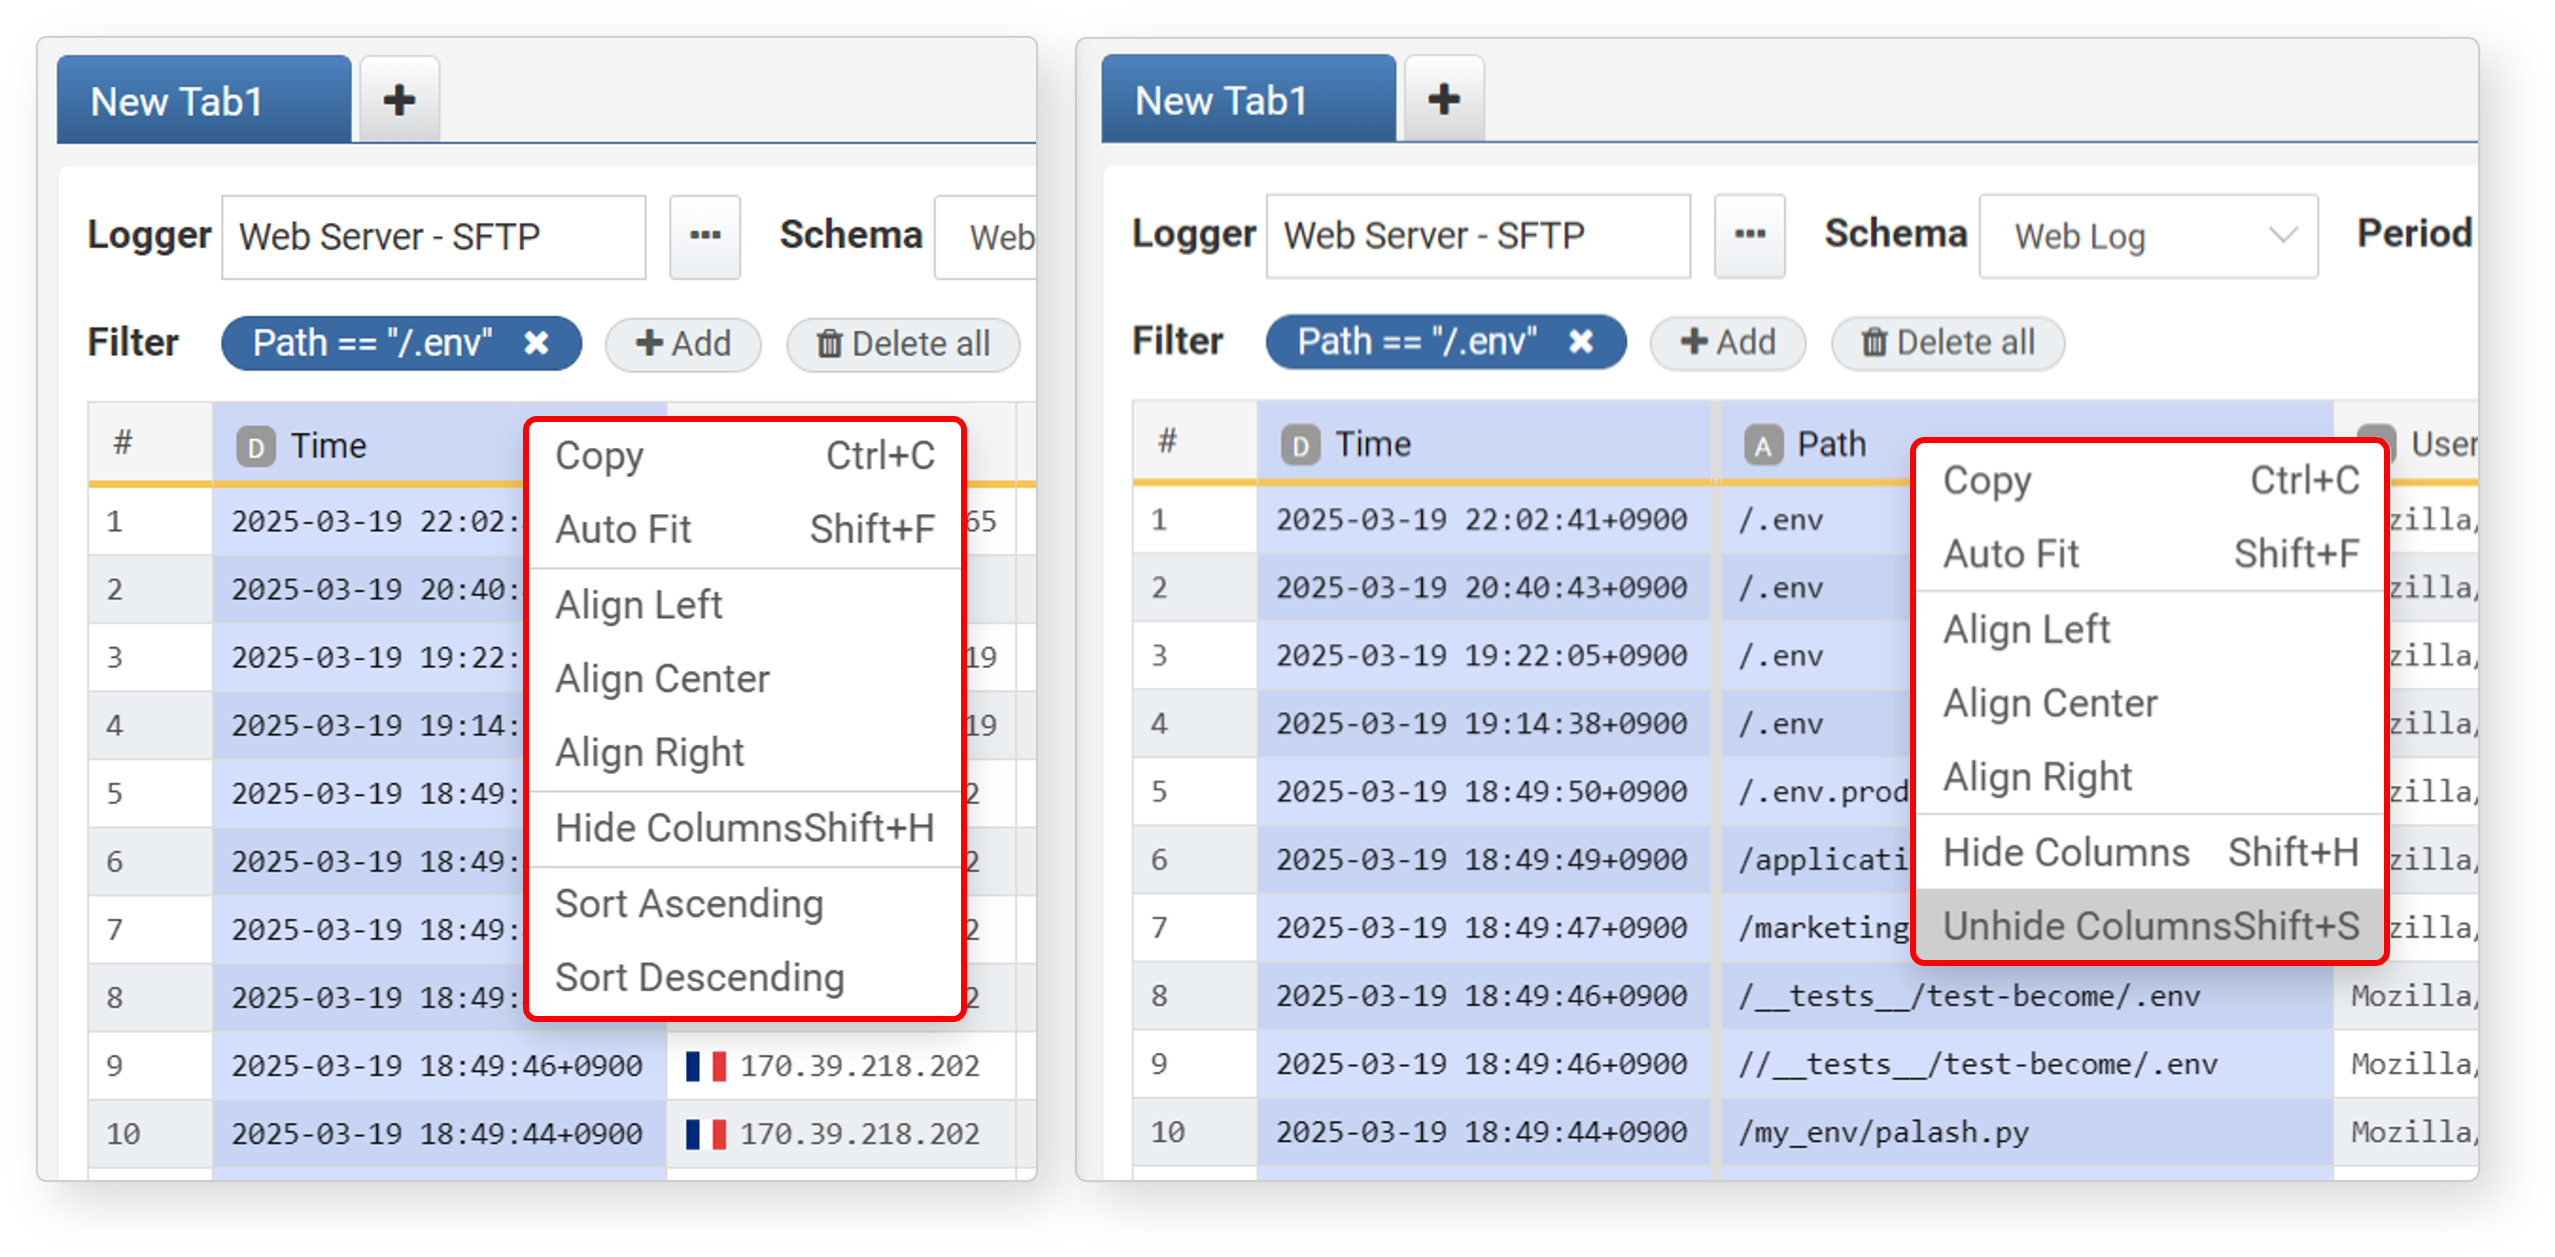
The menu provides options to sort data and manage field display:
- Copy (Ctrl+C): Copies the selected field's value.
- Auto Fit (Shift+F): Adjusts the column width to fit the content.
- Align Left/Center/Right: Sets text alignment for the field.
- Hide Columns (Shift+H): Hides the selected field from the view.
- Unhide Columns (Shift+S): Available when you select a field adjacent to a hidden one. Reveals hidden fields.
- Sort Ascending/Descending: Sorts data by the selected field.
To hide multiple adjacent fields:
-
Click the first field to hide, then Shift + Click the last field, or drag to select them.
-
Hide the fields using one of the following methods:
- Right-click + Shift, then select Hide from the menu
- Press Shift + H
To unhide hidden fields:
- Select the fields adjacent to the hidden fields or click the # field.
- Unhide the fields using one of the following methods:
- Right-click + Shift, then select Unhide from the menu
- Press Shift + S
Tabs
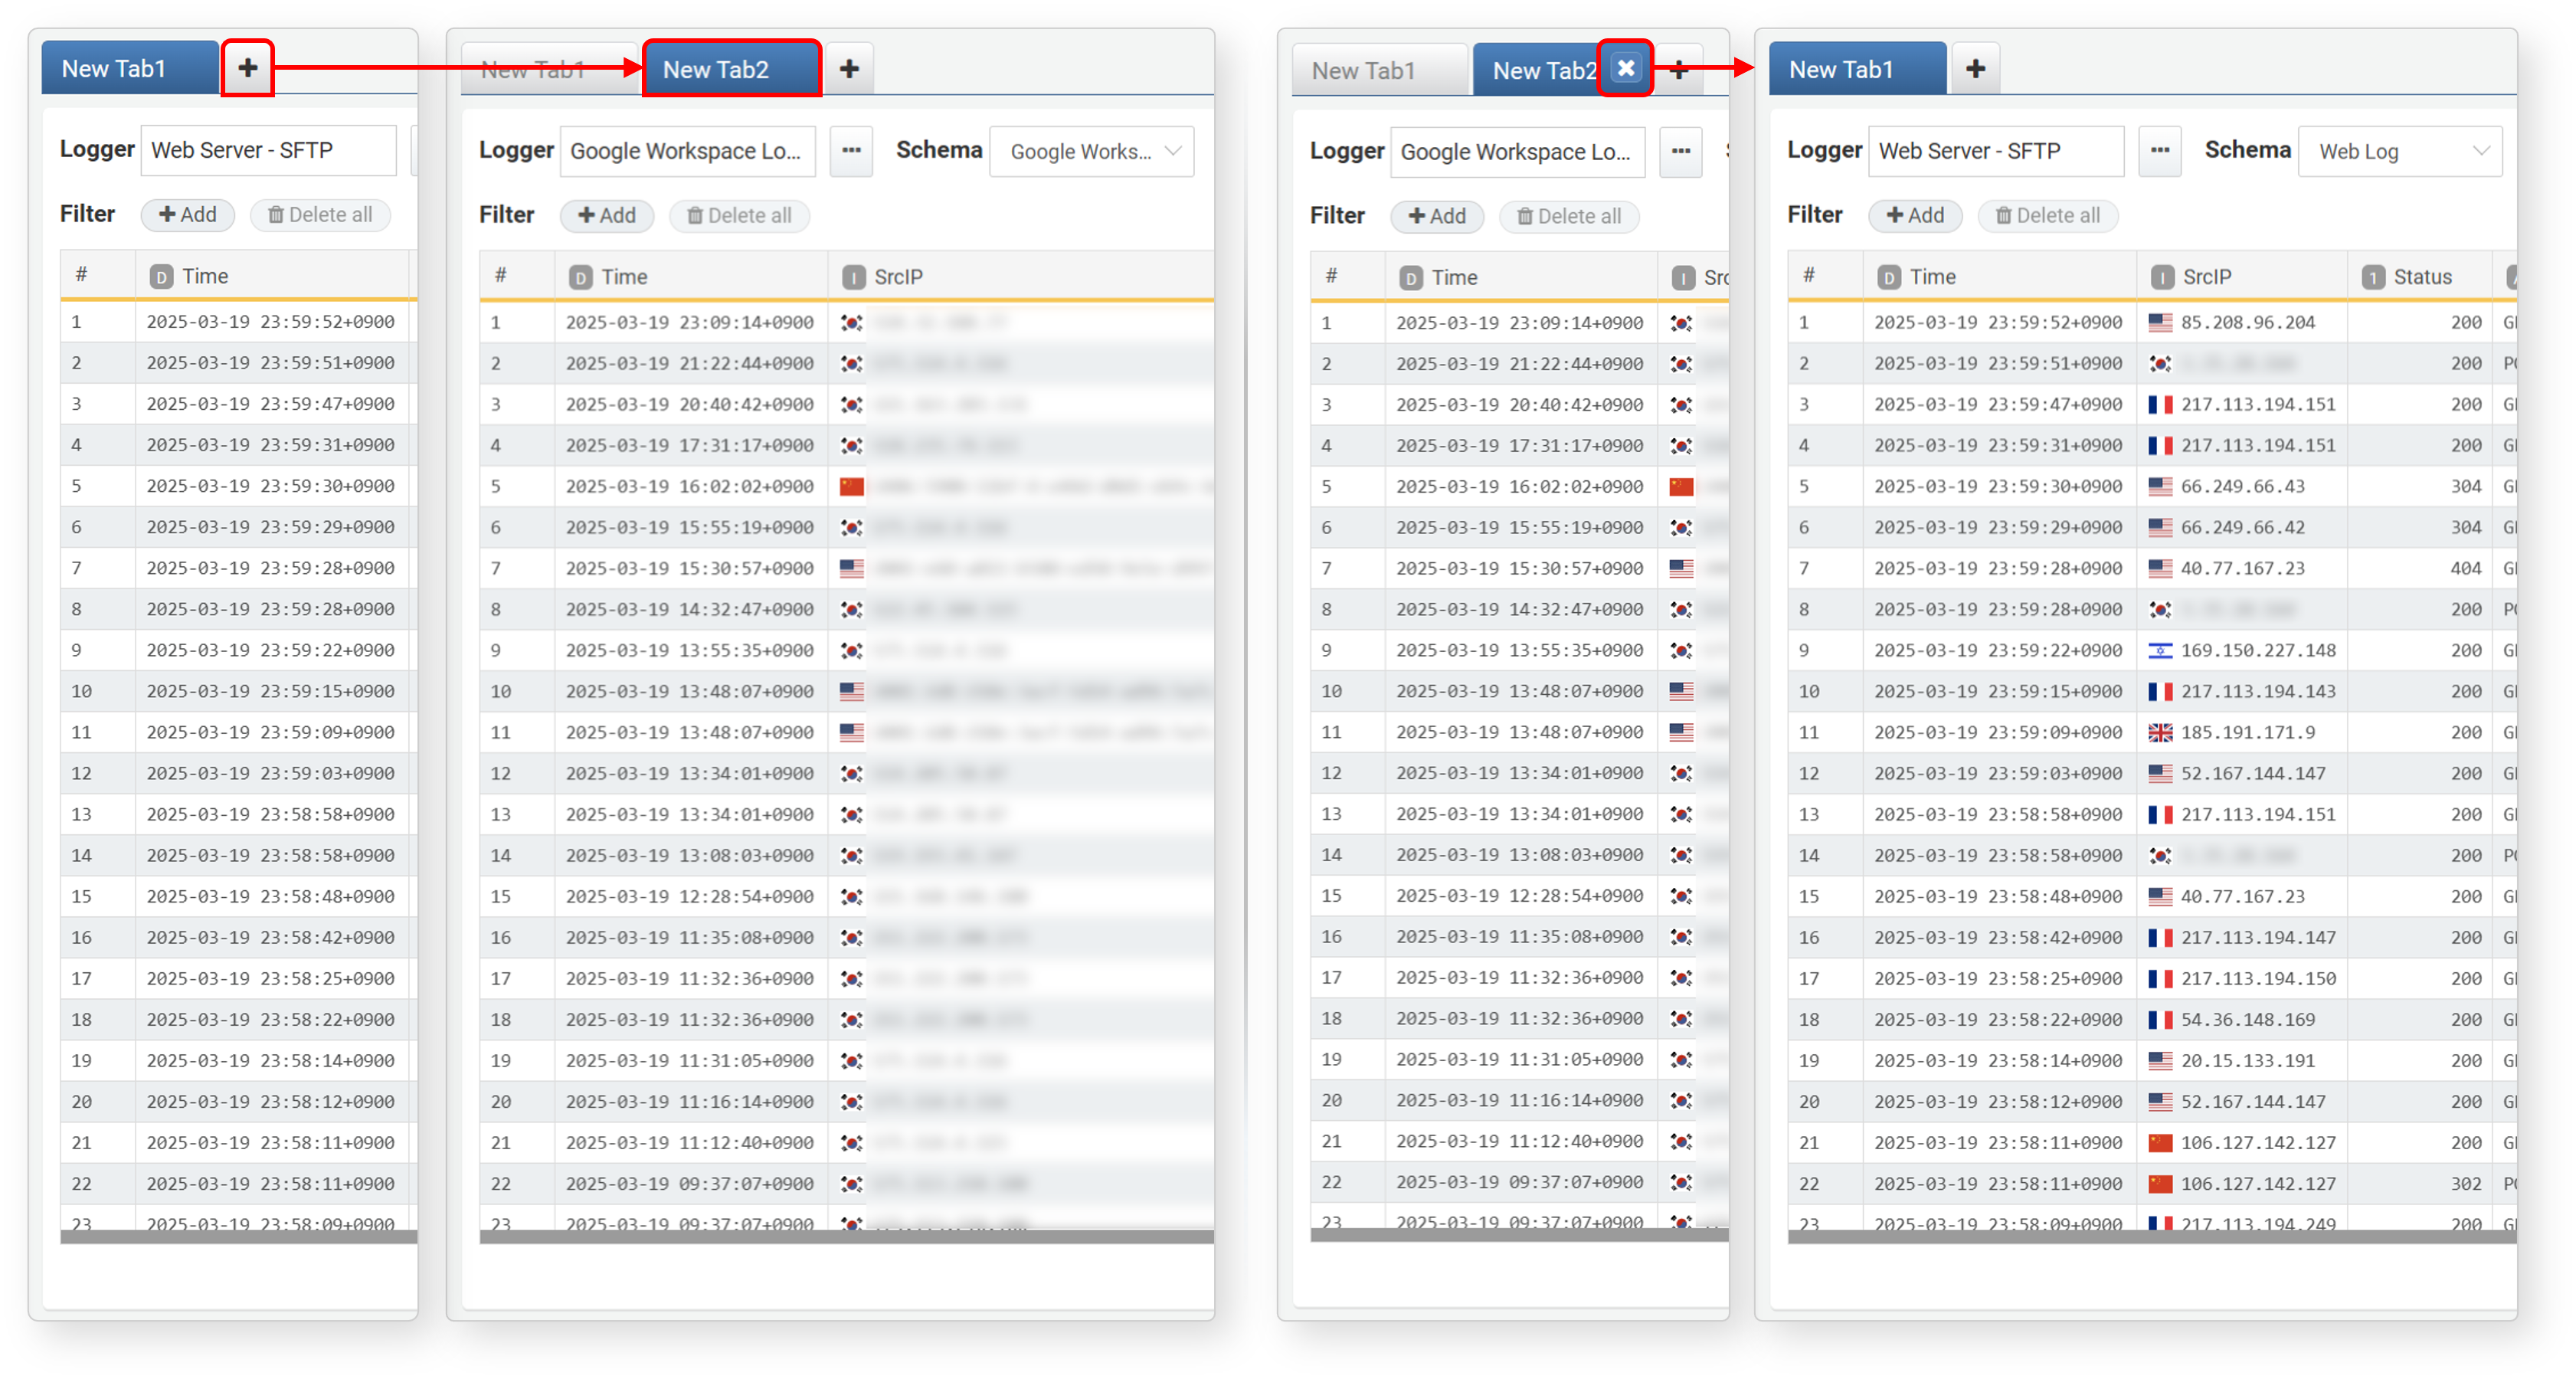
If you need to run multiple independent log queries, use tabs to manage them in separate views.
Save Results
You can convert search results into a dataset, store them as query results for quick access, or download them.
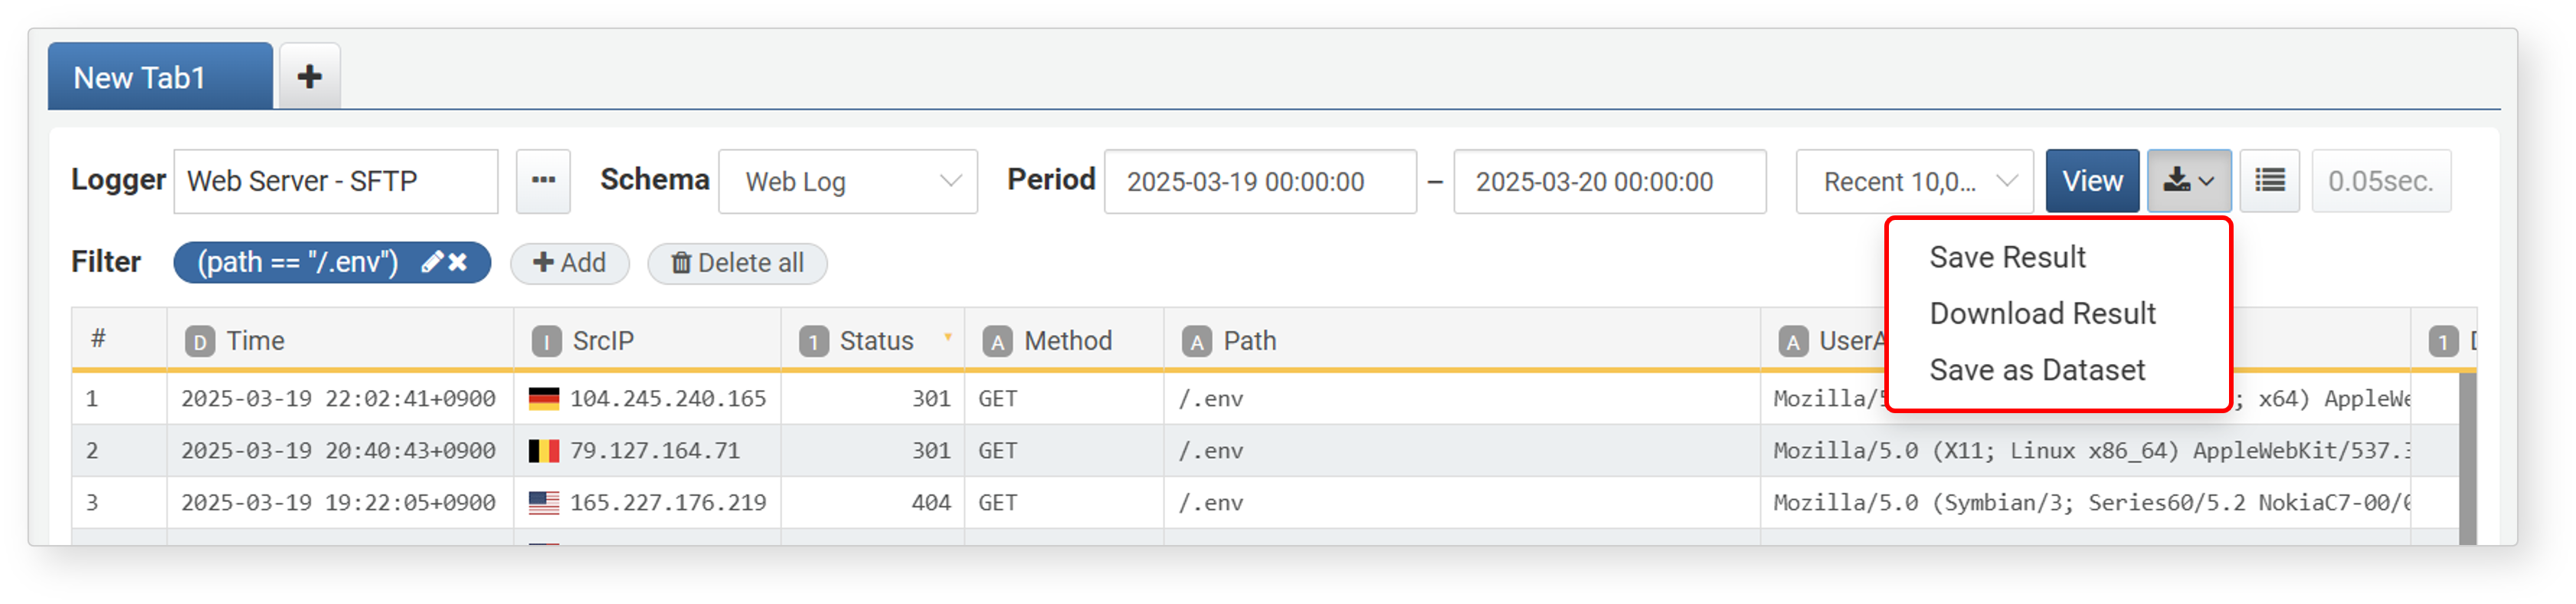
Save as Dataset
A dataset saves the query itself (not the result), so the data remains dynamic and reflects the latest records whenever queried. To save a log search result as a dataset:
- Click
 in the log search results screen.
 - Select Save as Dataset from the menu.
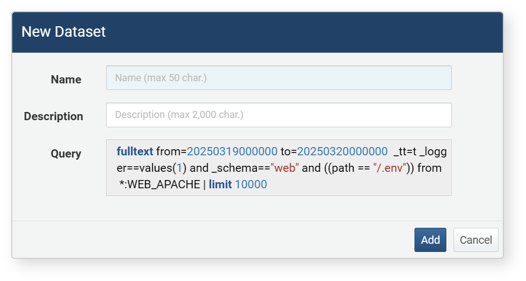
- In the Add Dataset dialog, enter a Name and Description, then click Add.
-
You can view saved datasets under Analysis > Datasets.
-
Saved datasets can be reused in other analysis features:
- Analysis > Events: Select the dataset as the data type and run a query.
- Analysis > Pivot: Use the dataset as the source type.
- Analysis > Queries: Load the dataset and perform a query.
- Dashboards > Widgets > Add Query Widget > Widget Editor: Use the dataset as the data type.
- Policies > Batch Rules: Use the dataset as the data source when adding a new scenario.
Refer to the dataset documentation for more details.
Save Query Result
When you save log search results as query results, you can later retrieve them without writing a new query. The saved query results can be accessed through Analysis > Query. For detailed instructions, see Loading Query Results in Analysis > Query.
To save log search results as query results:
-
Click the
button in the toolbar of the log search results screen. -
Select Save Result from the context menu.
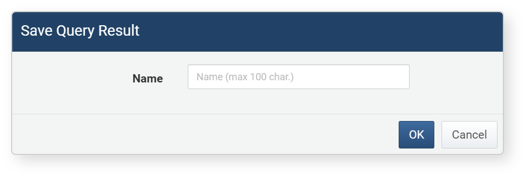
-
In the Save Query Result dialog, enter a name for the saved results and click OK.
- The query result data is stored on the server and can be retrieved later.
Download Query Result
To save log search results to your local PC:
-
Click the
button in the toolbar. -
Select Download Result from the context menu.
-
In the Download Query Result dialog, enter or select the log properties, then click Download.
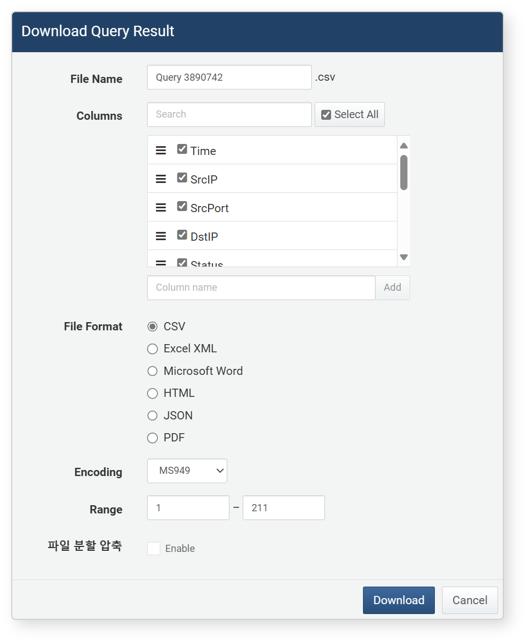
- File Name: The name of the file for the log search results to be downloaded (default: Ticket).
- Columns: The log properties to be saved in the file. Click Select All to record all properties in the file.
- File Format: The format of the file to be downloaded (default: CSV).
- CSV: CSV file
- Excel XML: XML file viewable in Microsoft Excel
- Microsoft Word: DOCX file
- HTML: HTML file
- JSON: JSON file
- PDF: PDF file
- Encoding: The file encoding (UTF-8, UTF-16 BE, MS949, default: MS949).
- Range: The number of logs to be recorded in the file. Only the specified number of logs, starting from the most recent, will be recorded in reverse chronological order.
- File Split: If enabled, you can specify the number of records per split file under Split Count (default: Disabled, Split Count default: 100,000, minimum 1,000 records). This option is supported from version 4.0.2409.0.