Query Monitor
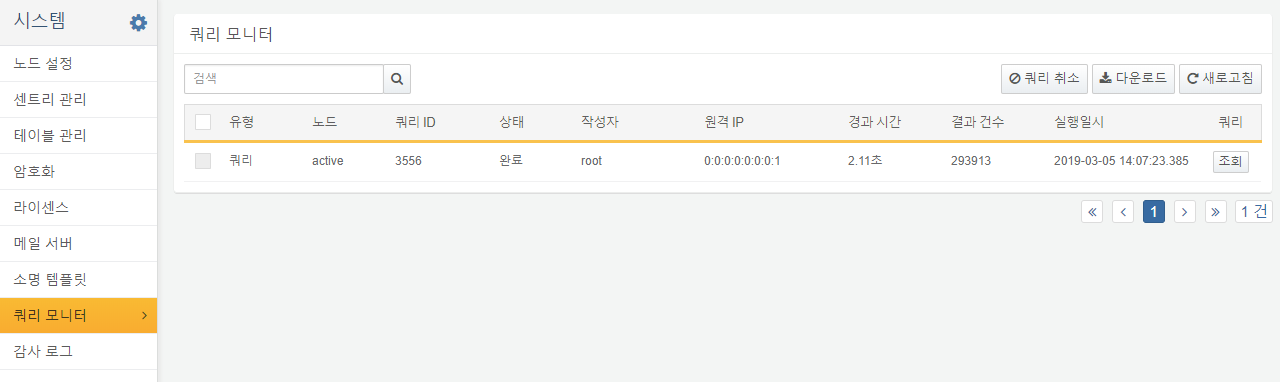
The Query Monitor provides real-time visibility into queries currently running in Logpresso Sonar. It allows users to inspect, copy, or cancel active queries as needed.
The following information is displayed for each query:
- Type: Type of query executed.
- Node: Node on which the query was executed.
- Query ID: Unique identifier of the query.
- Status: Current execution status of the query.
- Author: User account that initiated the query.
- Remote IP: IP address from which the query was executed.
- Elapsed Time: Time elapsed since the query started.
- Result Count: Number of results returned by the query.
- Run At: Date and time the query began execution.
- Query: The query statement.
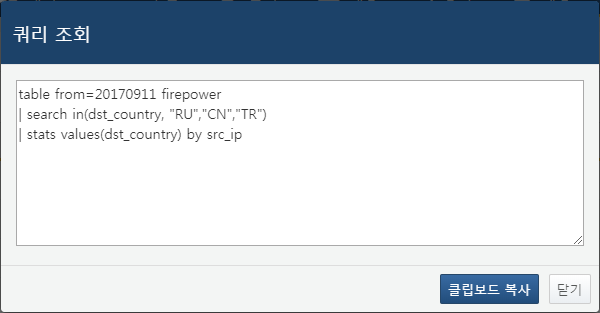
To view the full query text, click the View button. You can also copy the query statement directly using the Copy button. Tables specified with a wildcard (*) are expanded to a list of target tables before execution; for non-administrator accounts, this list includes only the tables and indexes they have read permission for, and the same filtering applies to the downloaded list as well.
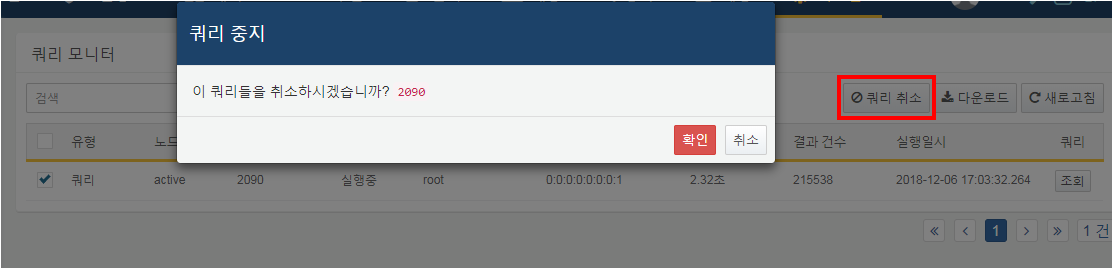
To stop a query that is currently running, select the query and click the Cancel Query button.