Queries
In Analysis > Queries, you can enter and execute Logpresso queries to perform data search and analysis. For detailed query syntax and command usage, refer to the Logpresso Query Documentation.
Try using queries in the following situations:
- Data search and analysis
- Learning Logpresso query syntax
- Pre-validating queries for detection rule development
Screen Layout and Features
Most queries follow the sequence of retrieving, filtering, and transforming data—typically from tables, loggers, or streams. Since the final destination for all data is a table, most queries begin with the table command. The query interface is designed to support this, with a logger list on the left and a query execution panel on the right.
-
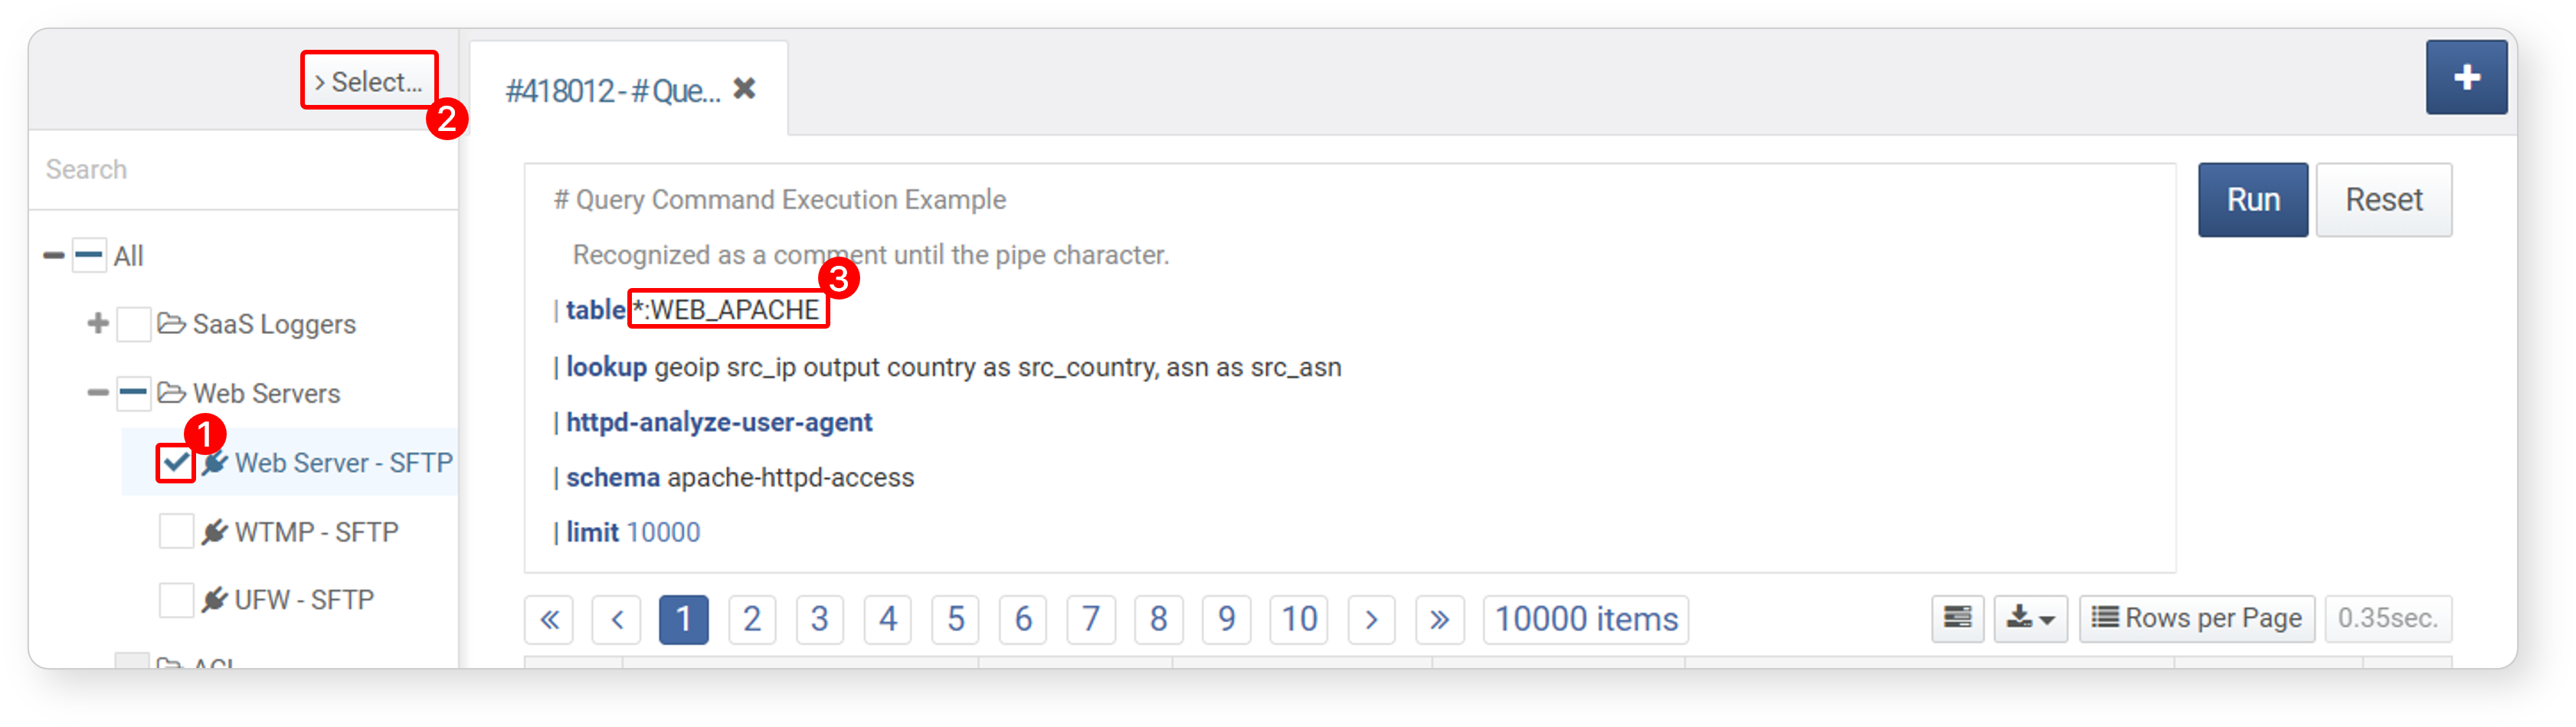
Logger List: Displays the full list of loggers. After selecting one or more loggers, click Select... at the top to populate the query input box with a list of all tables that store data from the selected loggers. Use this to specify tables as arguments for the
tablecommand. -
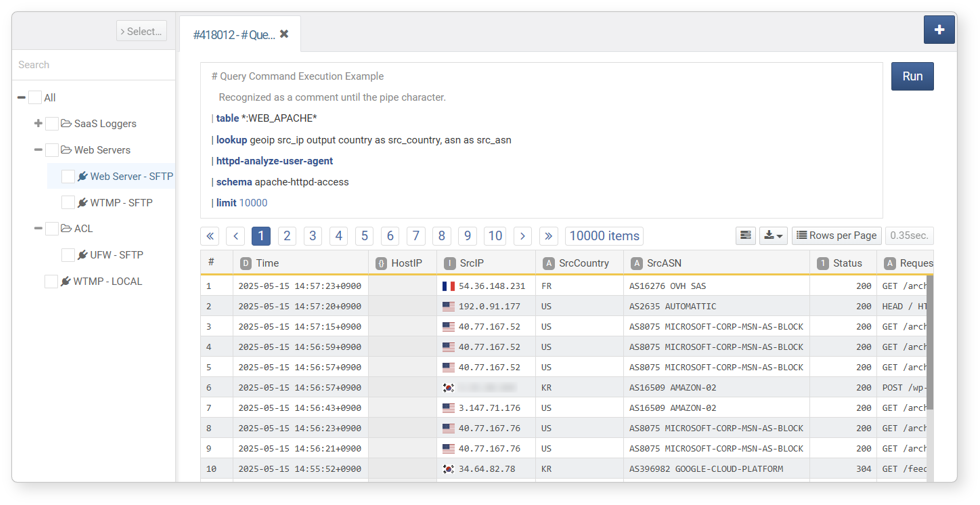
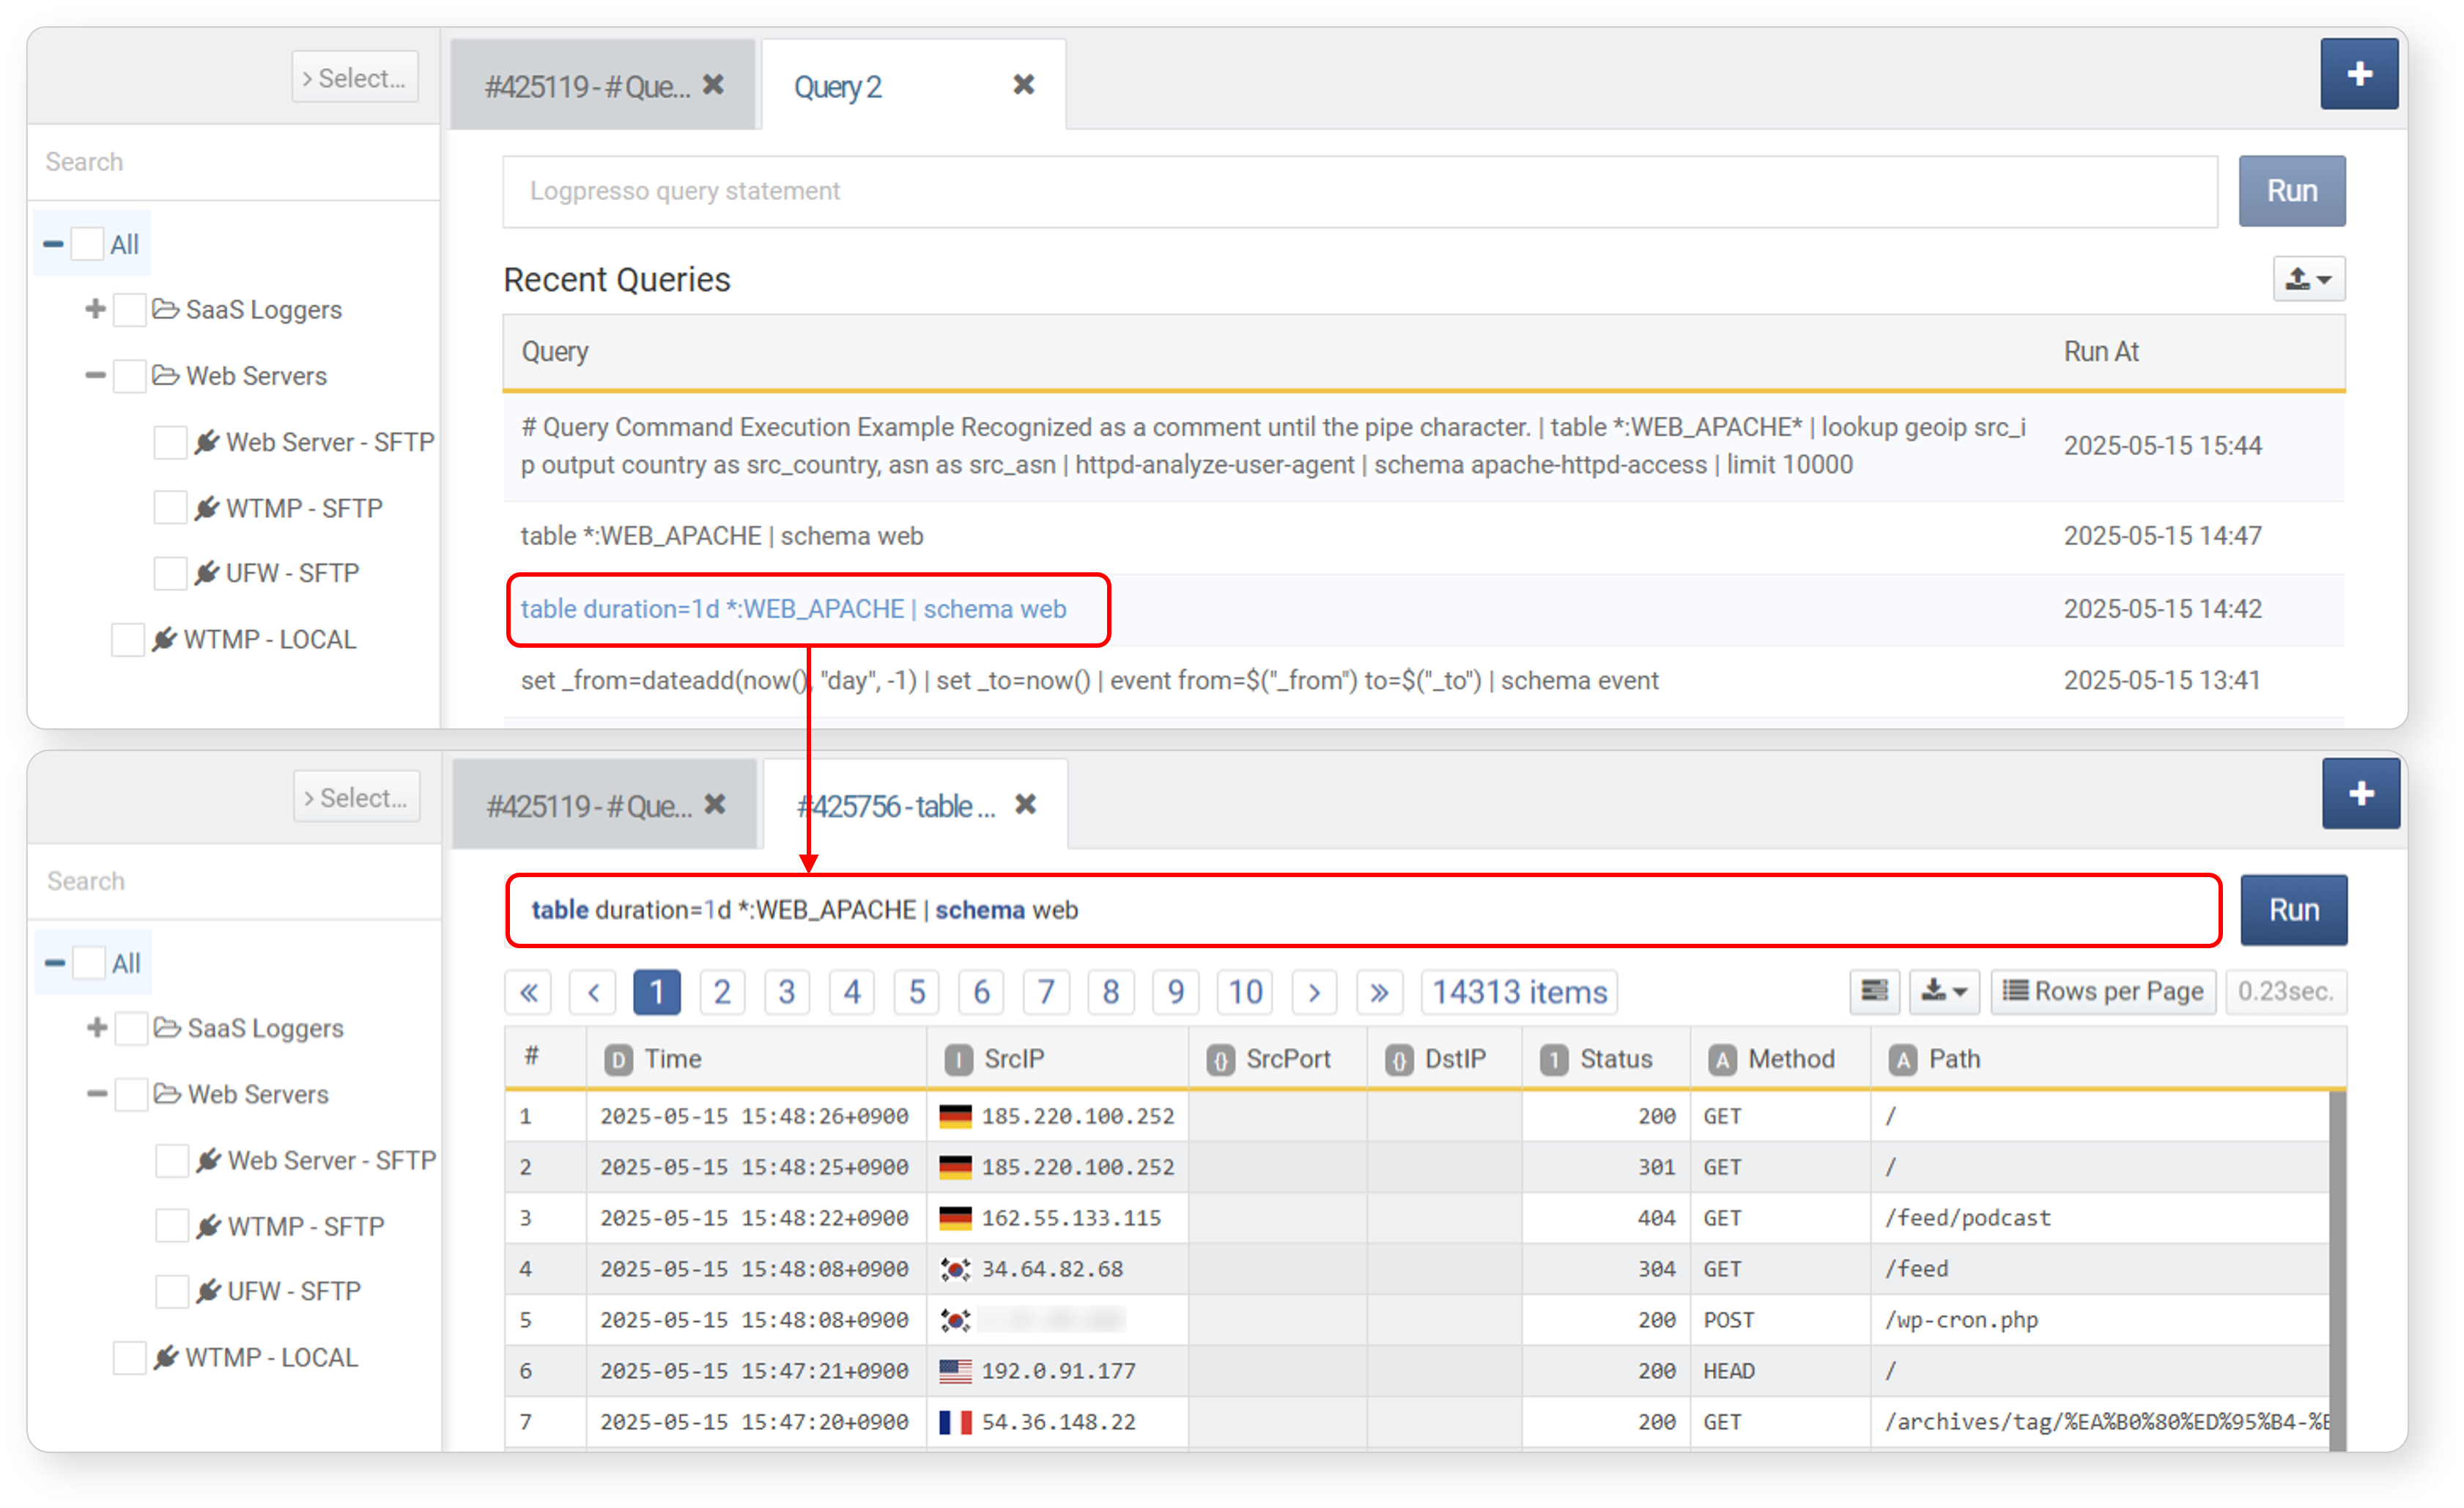
Query Execution Panel: The query execution panel supports multiple tabbed views. Each tab consists of a query input box at the top, run/cancel buttons, a toolbar, and the result view at the bottom.
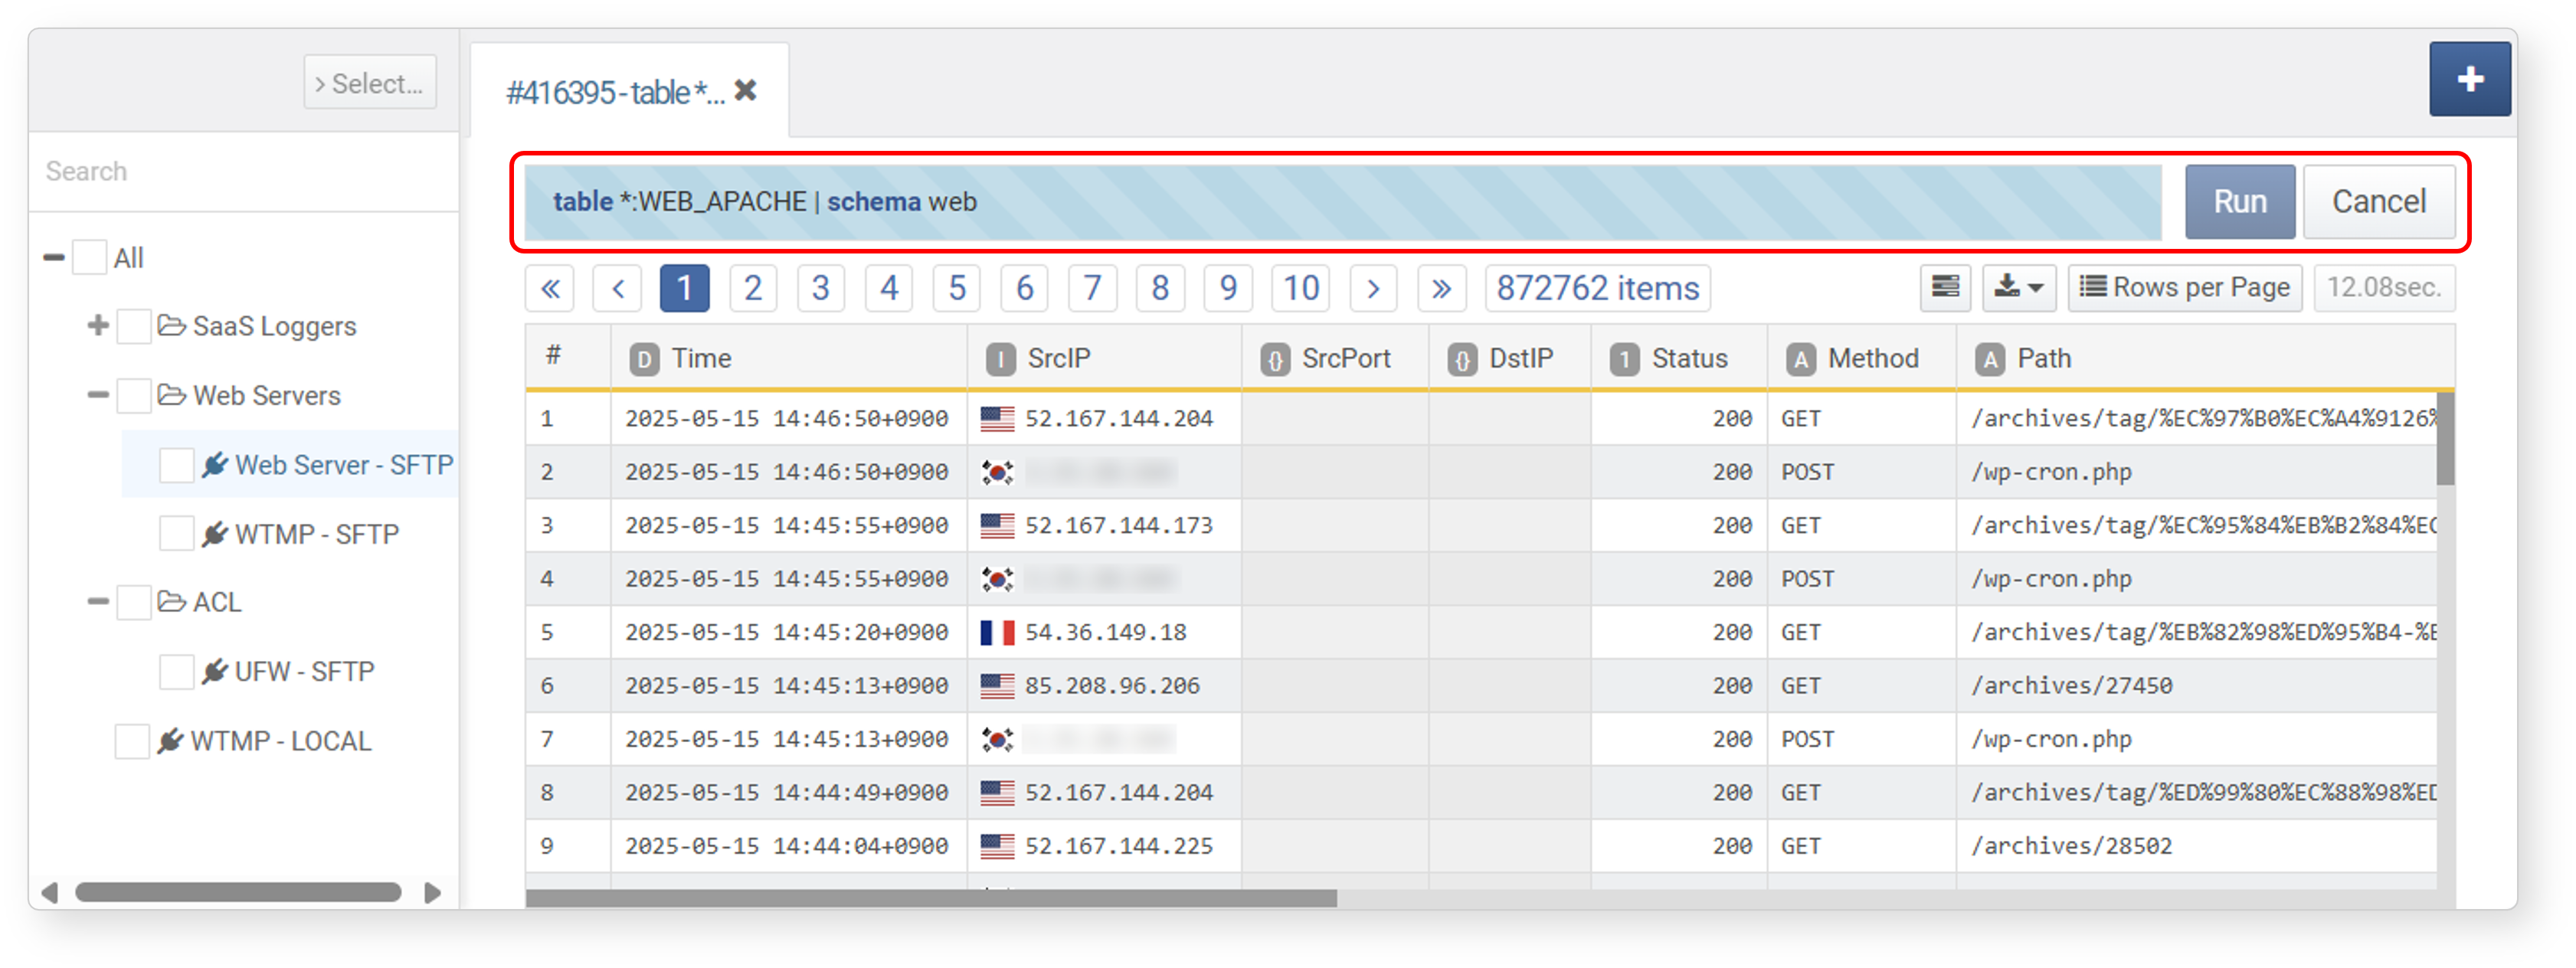
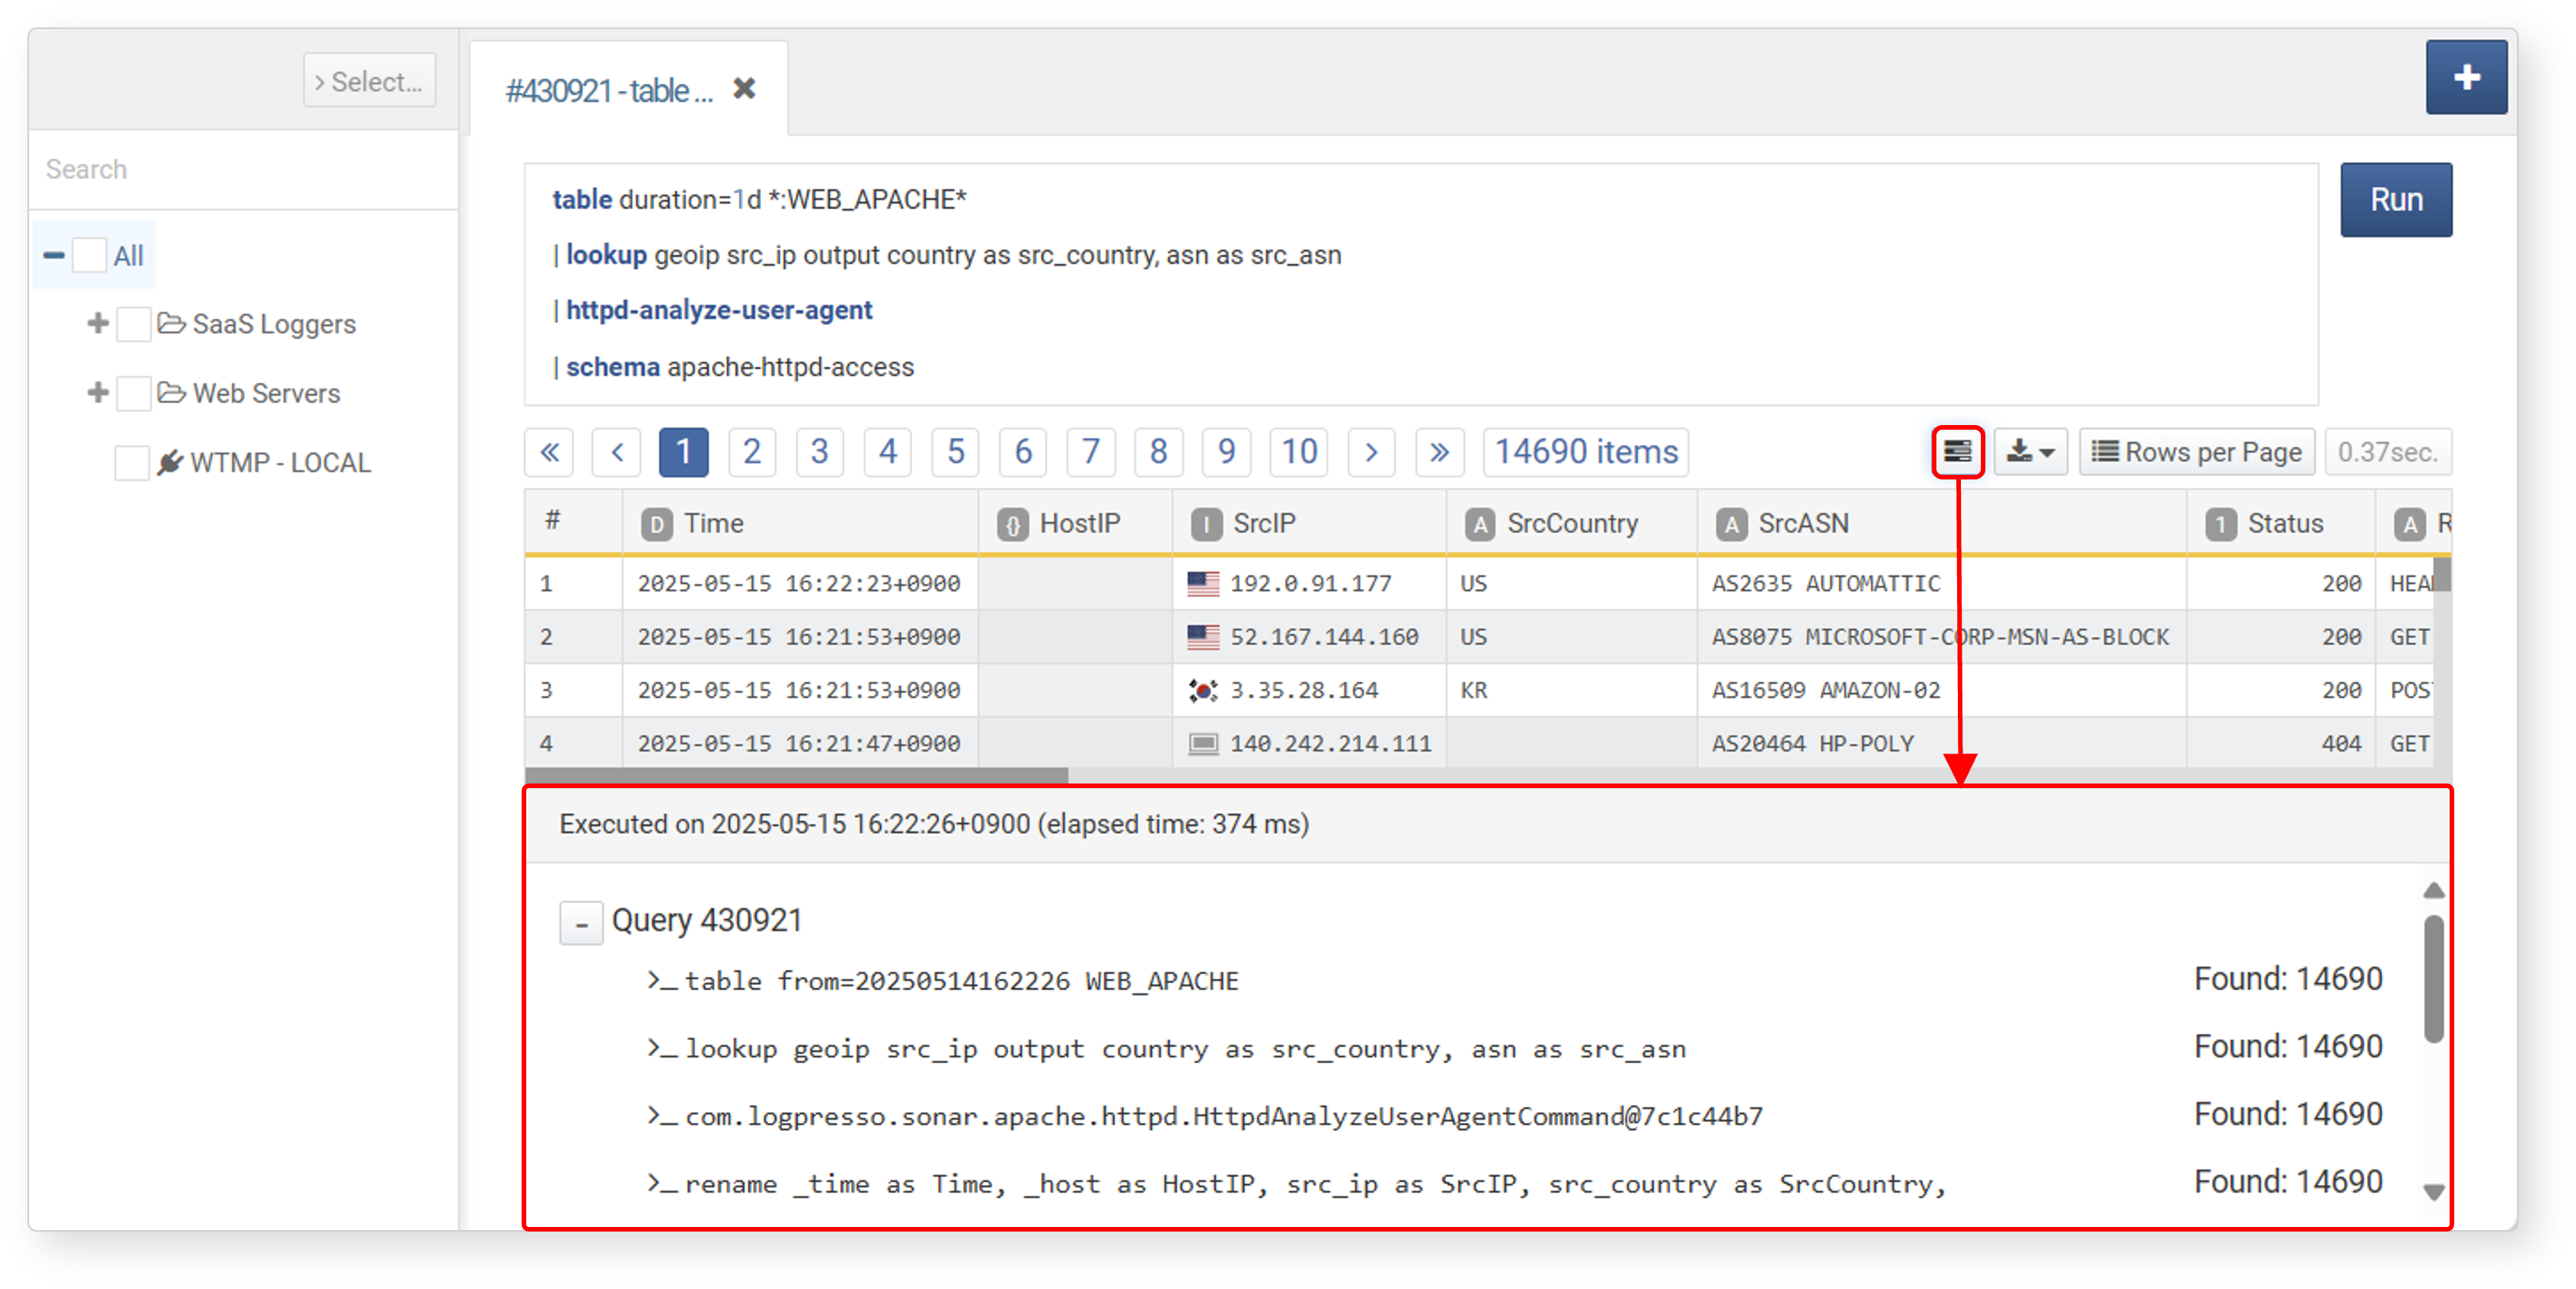
Below is an example where the query table duration=1d *:WEB_APACHE | schema web is entered into the input box and executed.
- Each tab displays a Query ID, which is a unique identifier for the executed query.
- In addition to Load Query Results and Load Datasets, the toolbar includes the following tools:
- Toggle step-by-step result panel
- Query execution time
- Download/save query results, save datasets
- Number of displayed items
- Query execution time
If the query execution time is long, the background color of the query input box changes to indicate that the query is in progress, and a Cancel button appears next to Execute. To stop a running query, click Cancel.
Query Input Box
The query input box has the following characteristics:
- Logpresso query statements are separated by the pipe (
|) character rather than newline characters. - When a query spans multiple lines, the input box can expand up to 12 lines. A scrollbar will appear if the input exceeds 12 lines.
- Logpresso query commands, numbers, and strings are color-coded for clarity.
- Lines starting with
#are considered comments. - You can execute the query statement by pressing the shortcut keys Shift+Enter or Ctrl+Enter.
Auto-Completion
The query input box supports auto-completion and line wrapping. These features are available not only in Analysis > Queries, but also in any query input box across the system.
| Feature | Shortcut |
|---|---|
| Help & Auto-Completion | Ctrl + Space or Ctrl + Shift + Space (Windows), Cmd + Space (macOS) |
| Line Wrapping | Ctrl + Shift + F |
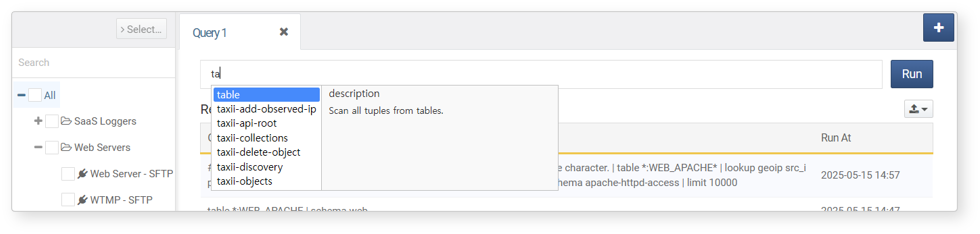
Command Auto-Completion
:Type a command prefix (e.g., ta) and press the auto-completion shortcut. A list of commands starting with the entered prefix will appear. Select a command from the list and press Enter to insert it into the input box.
-
If the prefix uniquely matches a command, it will be inserted automatically without showing the suggestion list.
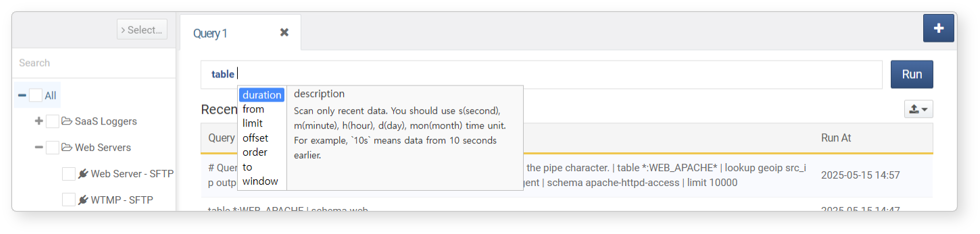
- Option Auto-Completion
-
To view available options for a command, type a space after the command and press Ctrl+Enter. A list of supported options with descriptions will appear. Select an option and press Enter to insert it.
-
You can also type an option prefix (e.g.,
fr) and press the auto-completion shortcut to filter the list. If the prefix uniquely matches an option, it will be inserted automatically. - Line Wrapping
-
When writing queries with multiple pipe operators, readability can decrease. Press Ctrl + Shift + F in the query input box to automatically insert line breaks for better readability.
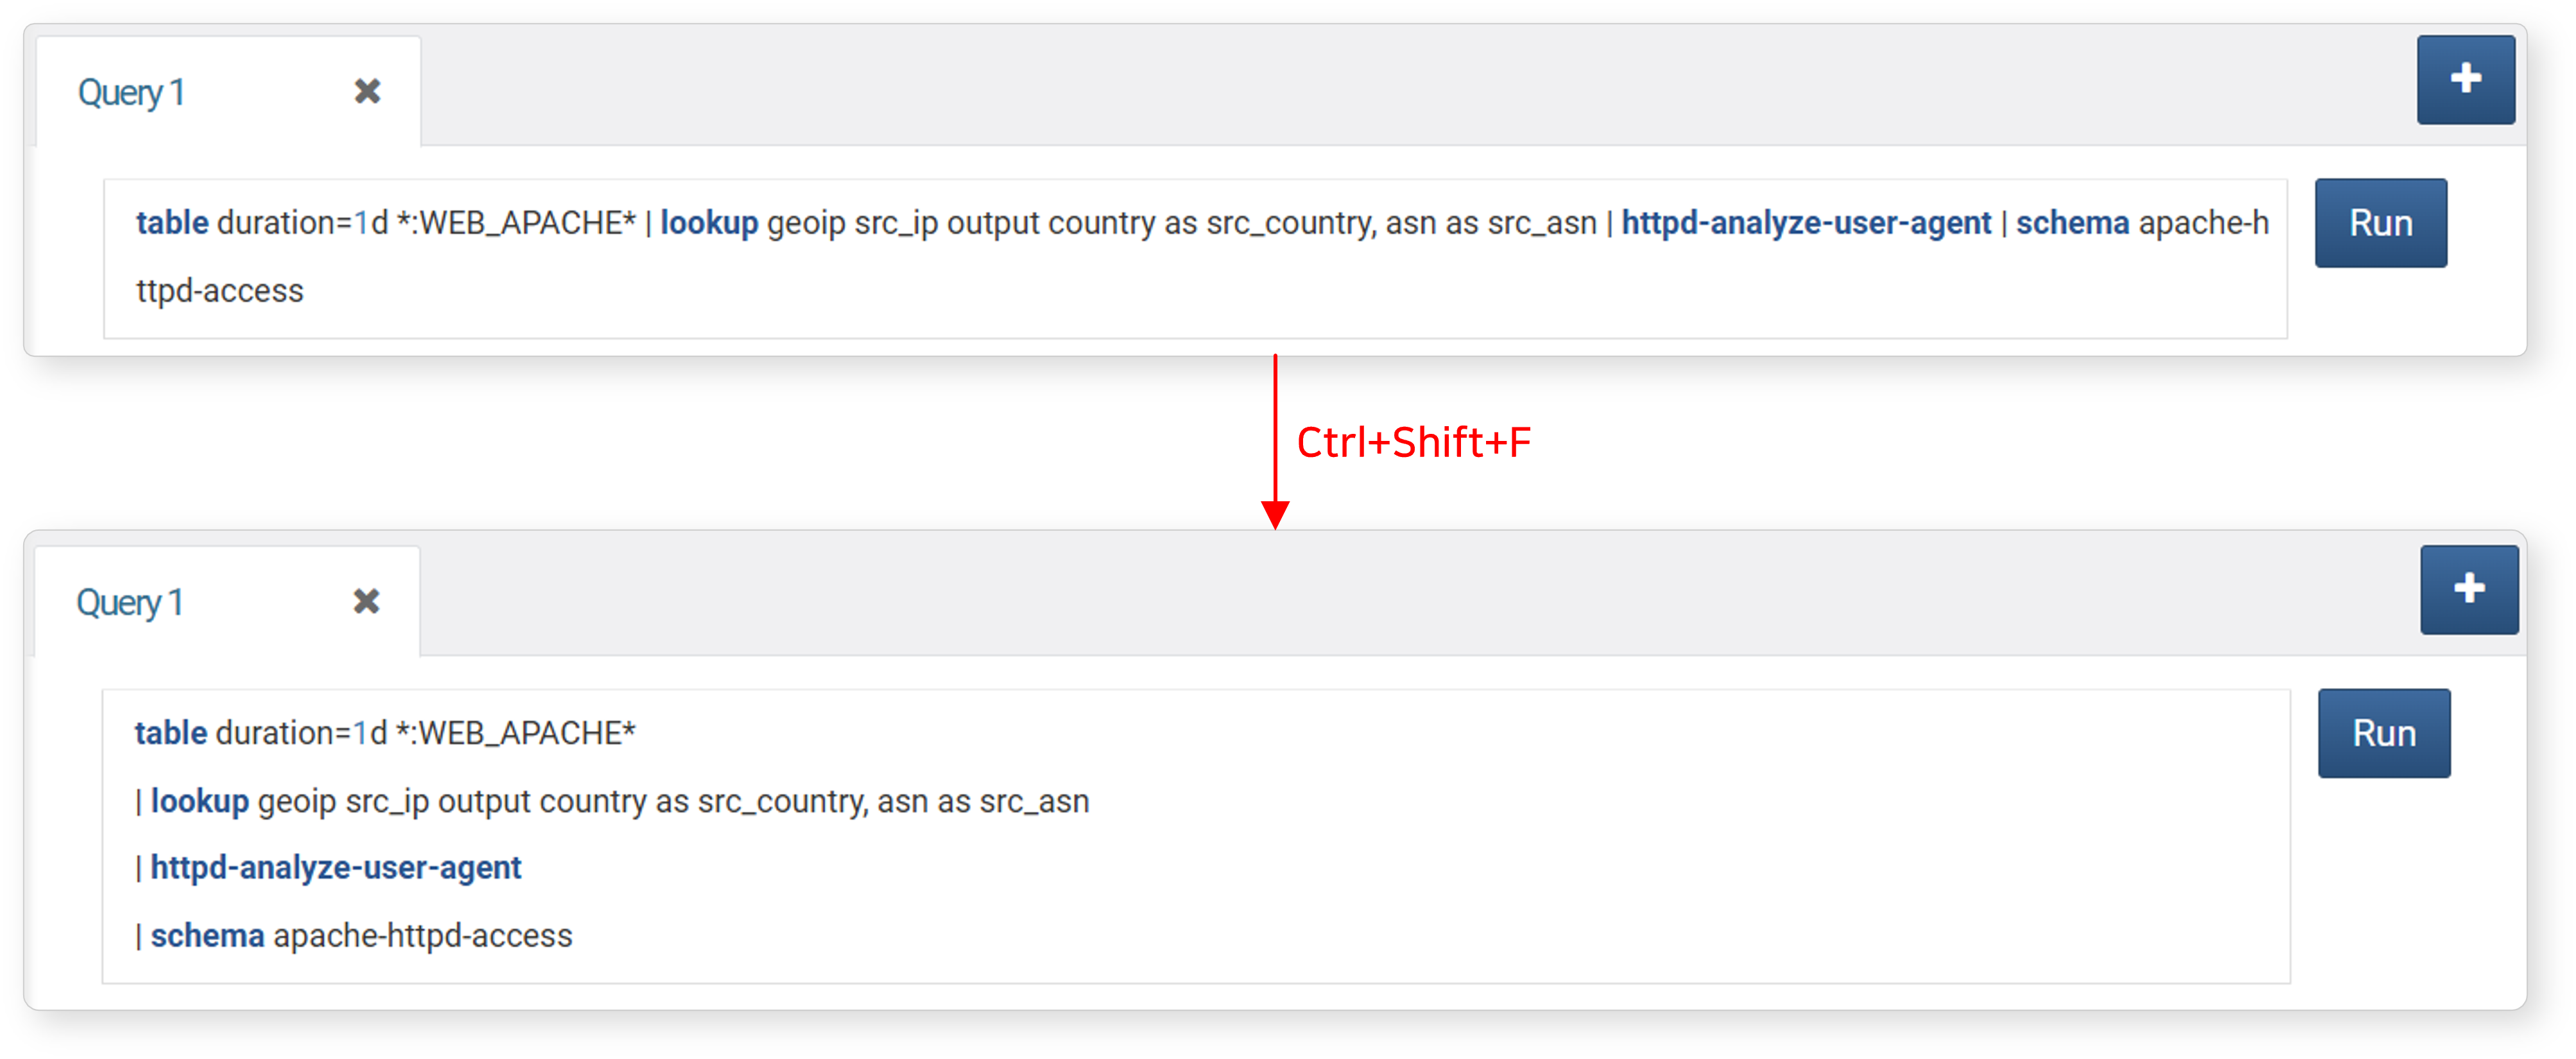
Table Input
After selecting a logger from the logger list, click Select... to insert table names into the query input box in the format *:TABLE (where * indicates all nodes). For table naming conventions, refer to the table command.
Query Tabs
To run multiple queries, use tabs to open a new tabbed interface for each query. Click the close (X) button on a tab to close it.
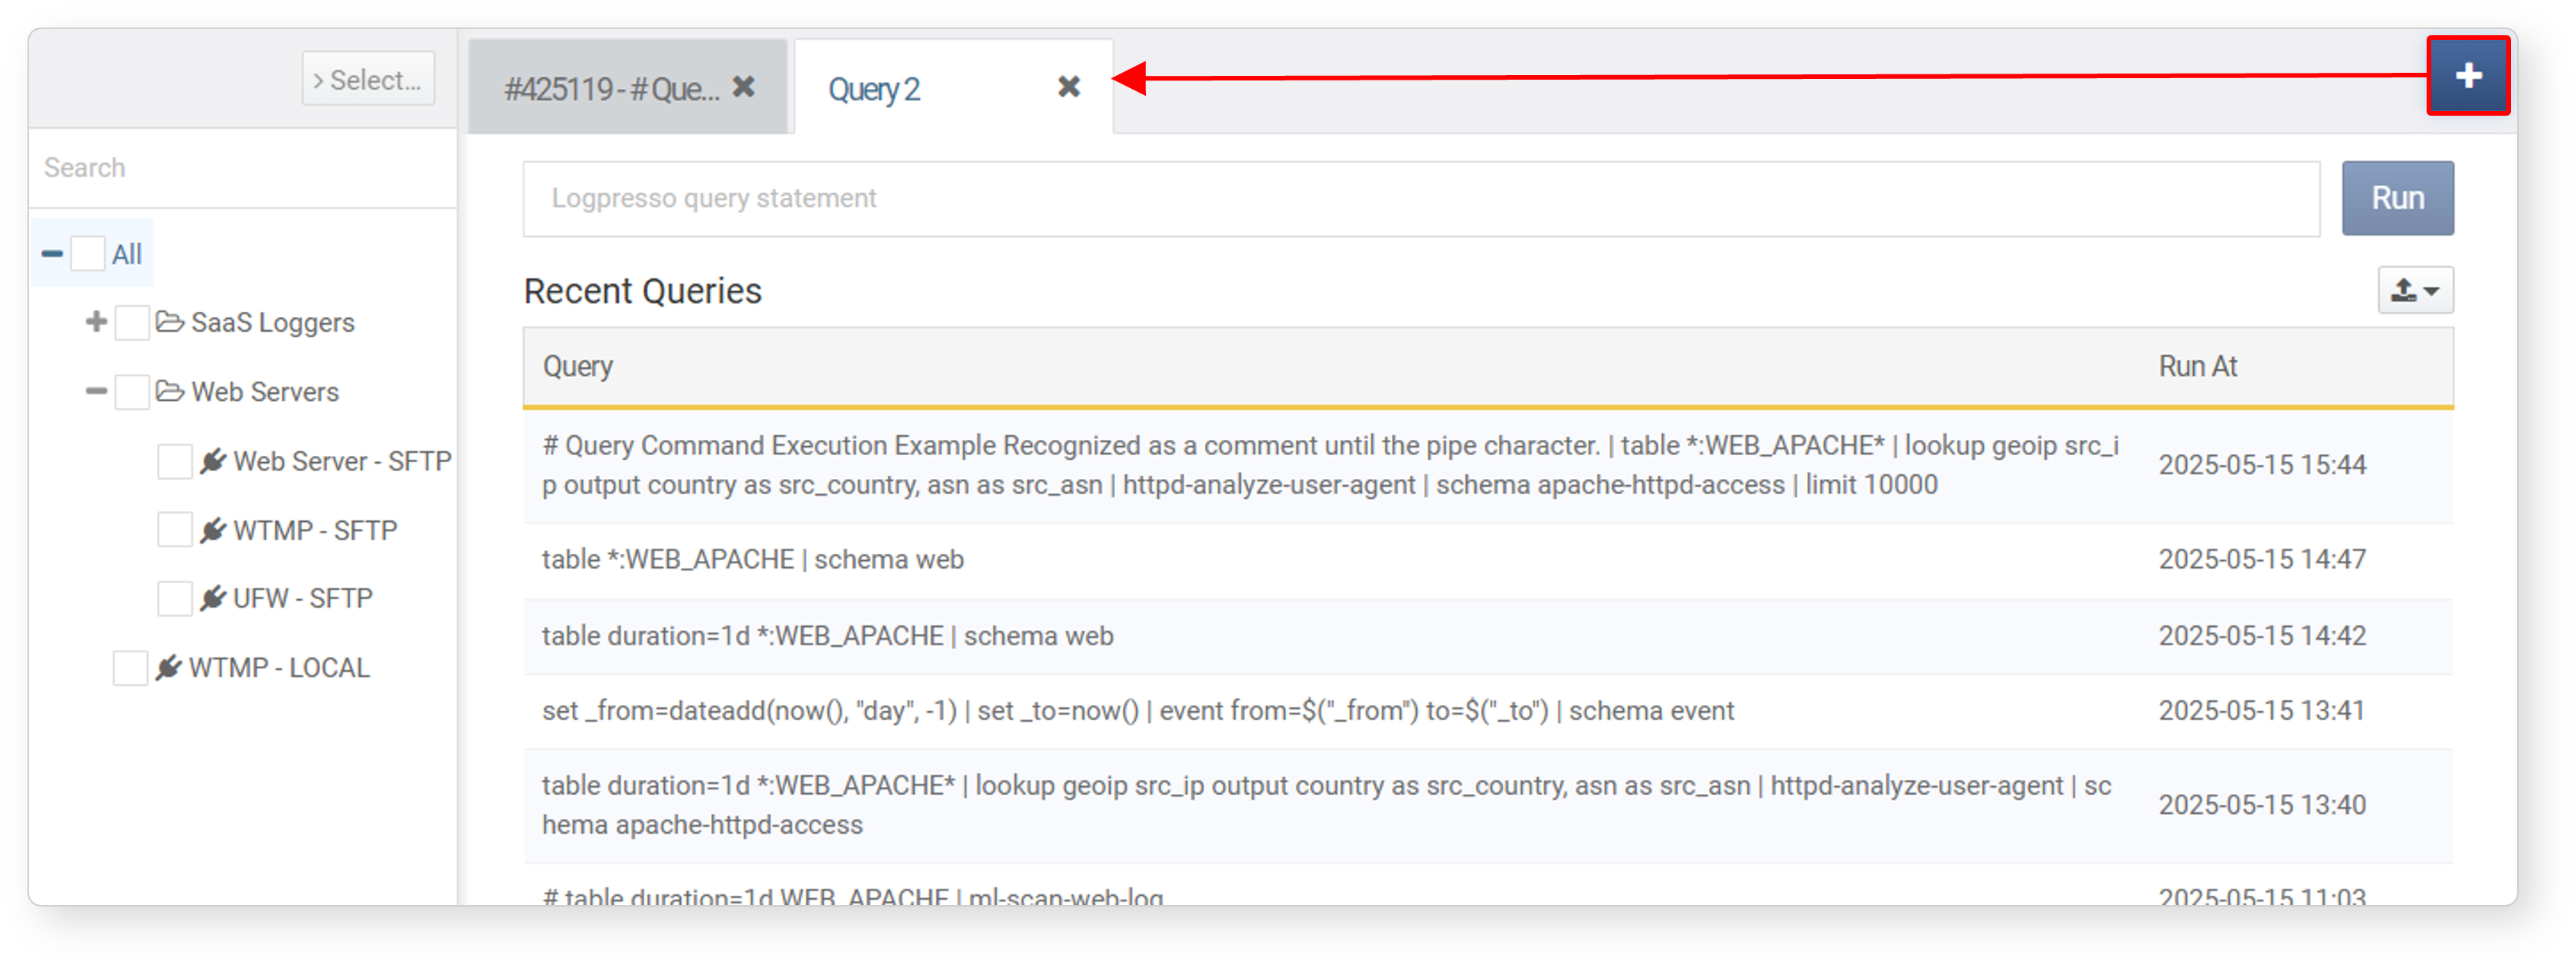
Re-Run Recent Query
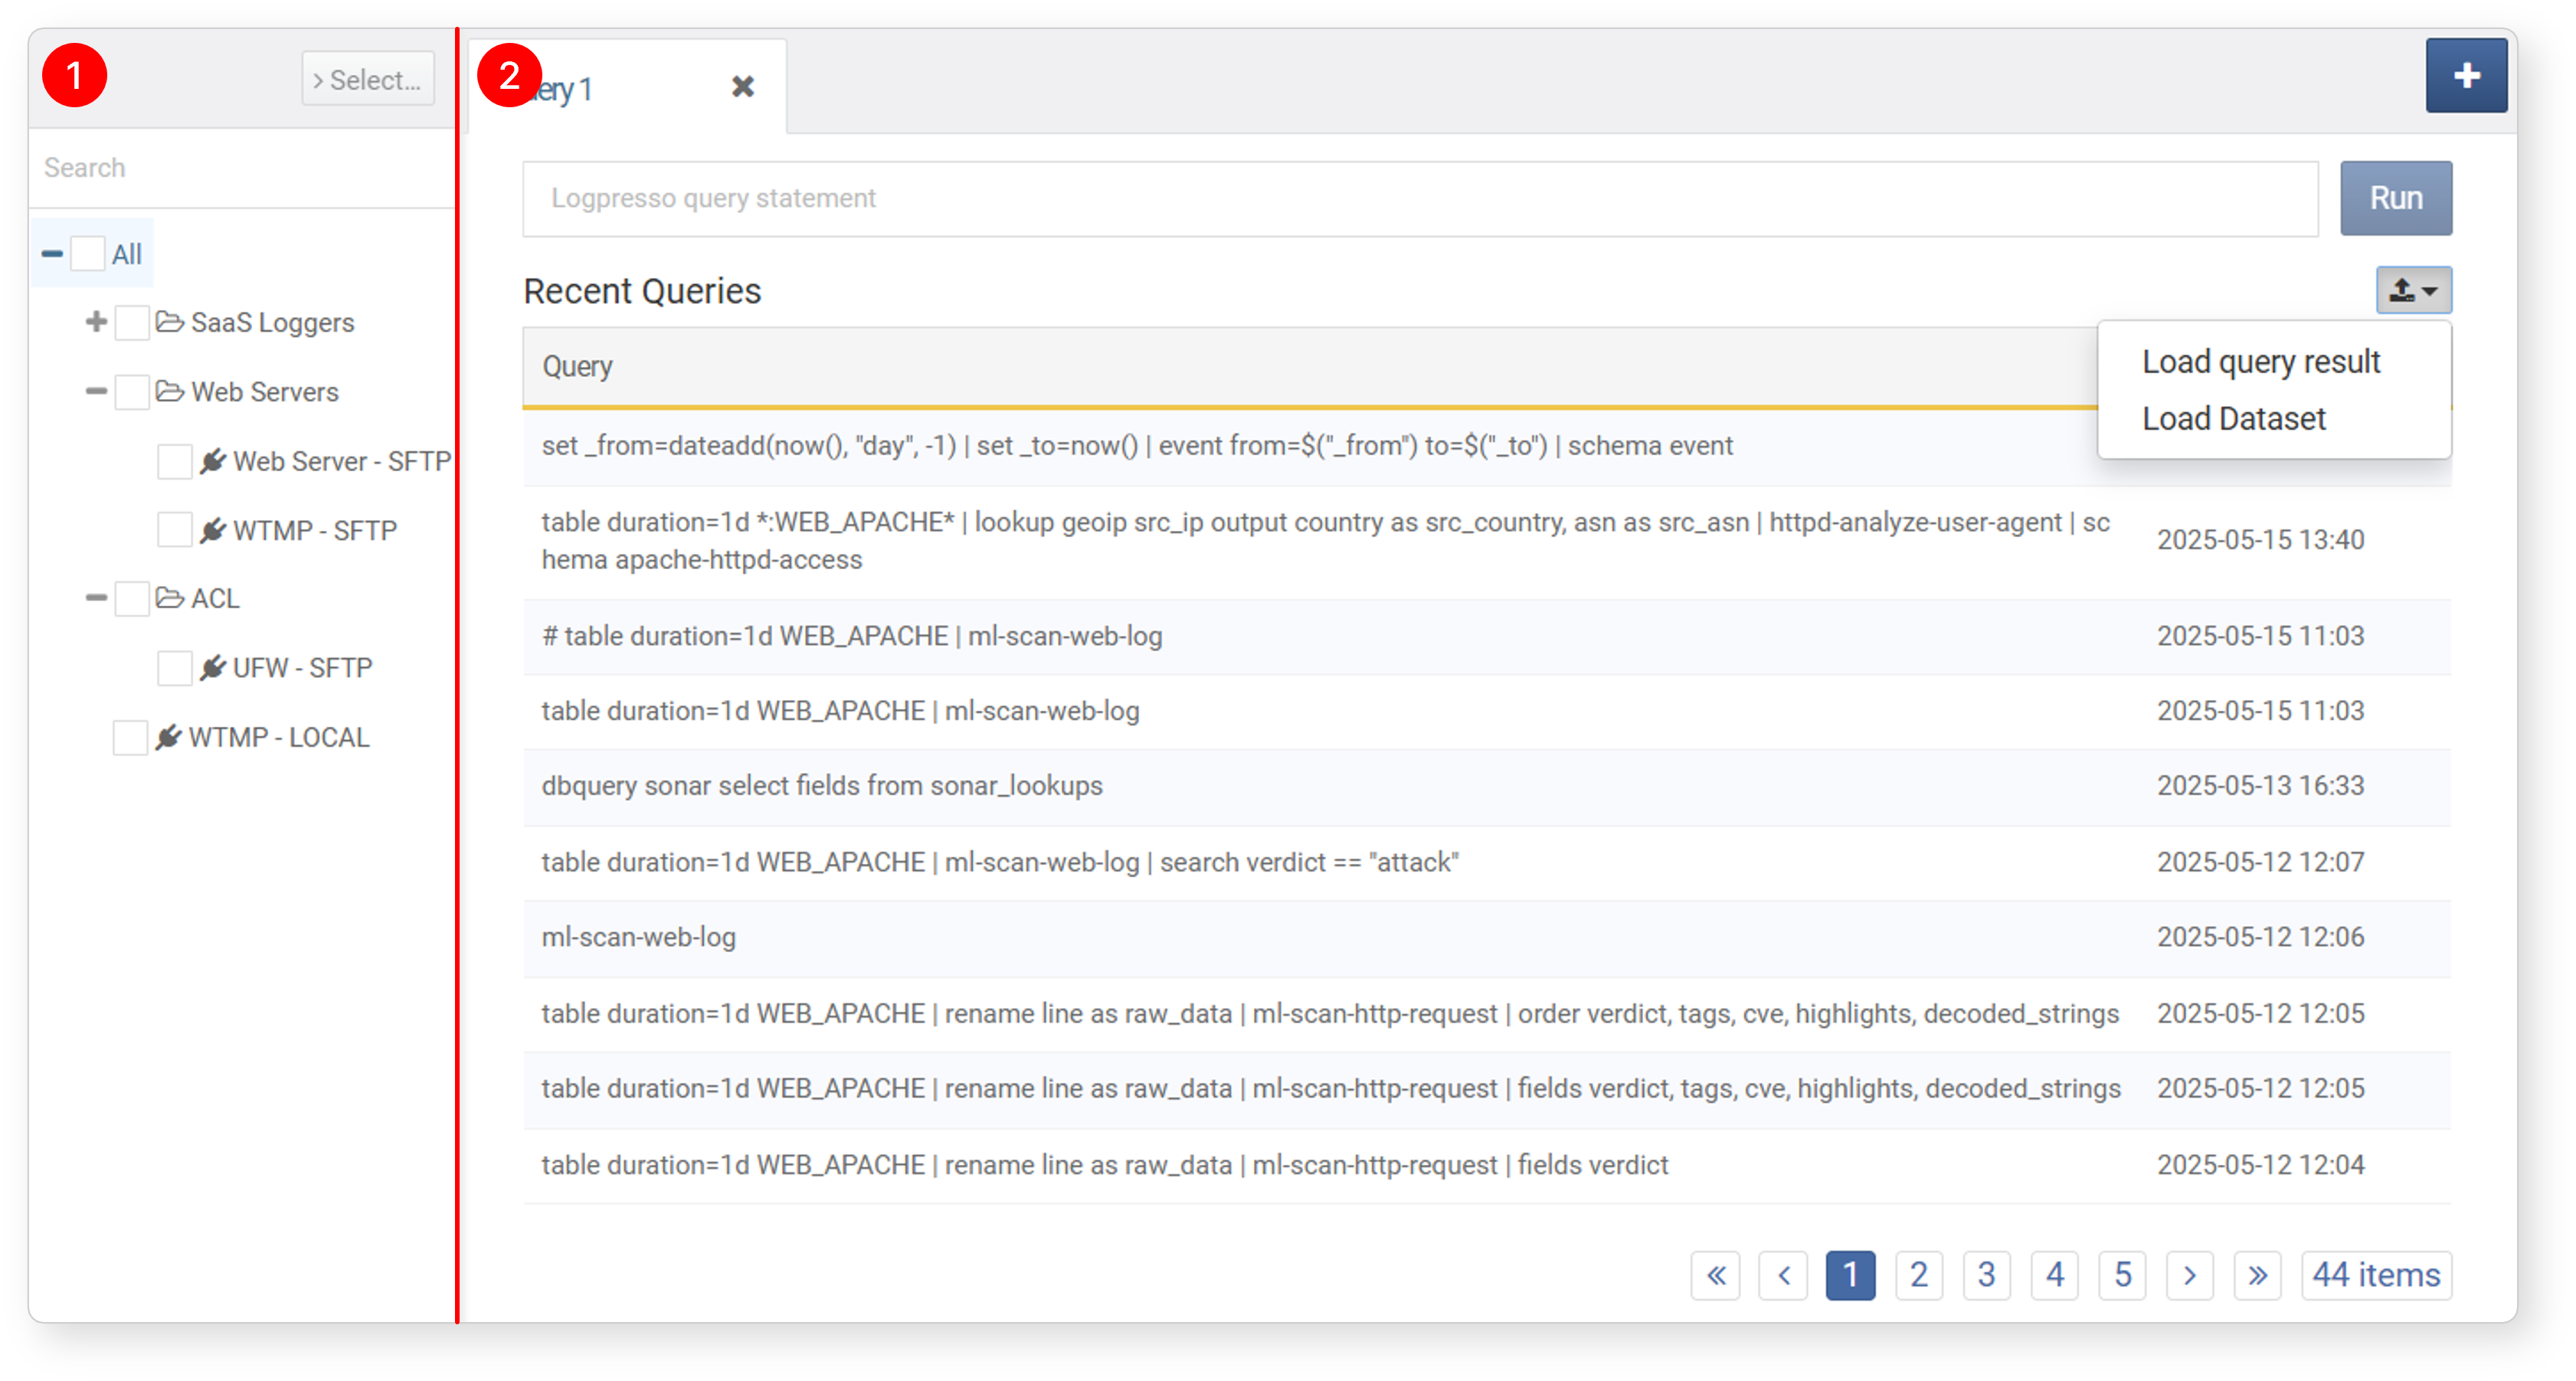
When a new tab is opened, a list of recently executed queries will be displayed. Selecting a query from the list will immediately re-run it.
View Running Query
You can view the list of currently running queries in System > Query Monitor.
Load Saved Data
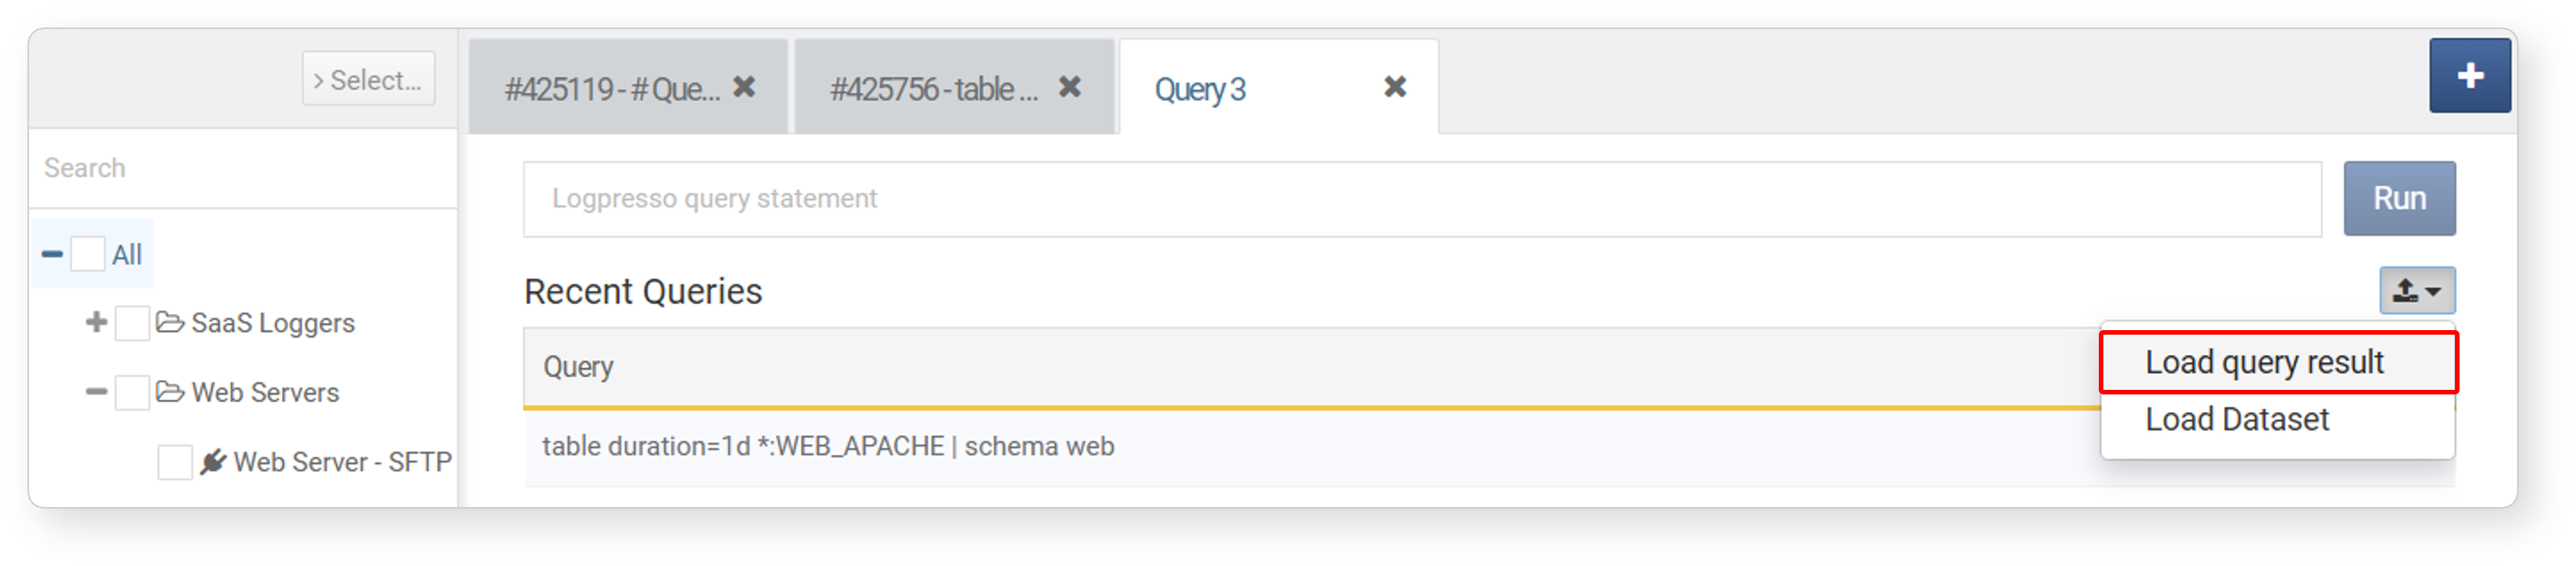
Load Query Result
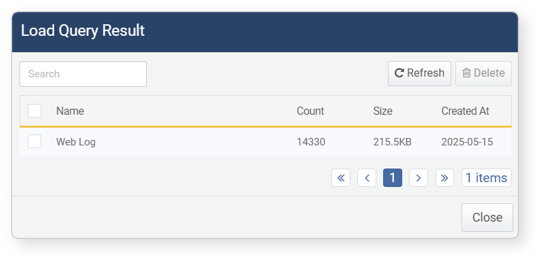
You can view query results saved from Events, Logs, Pivot, and Queries. Query results represent the data saved at the time of query execution. To load query results:
-
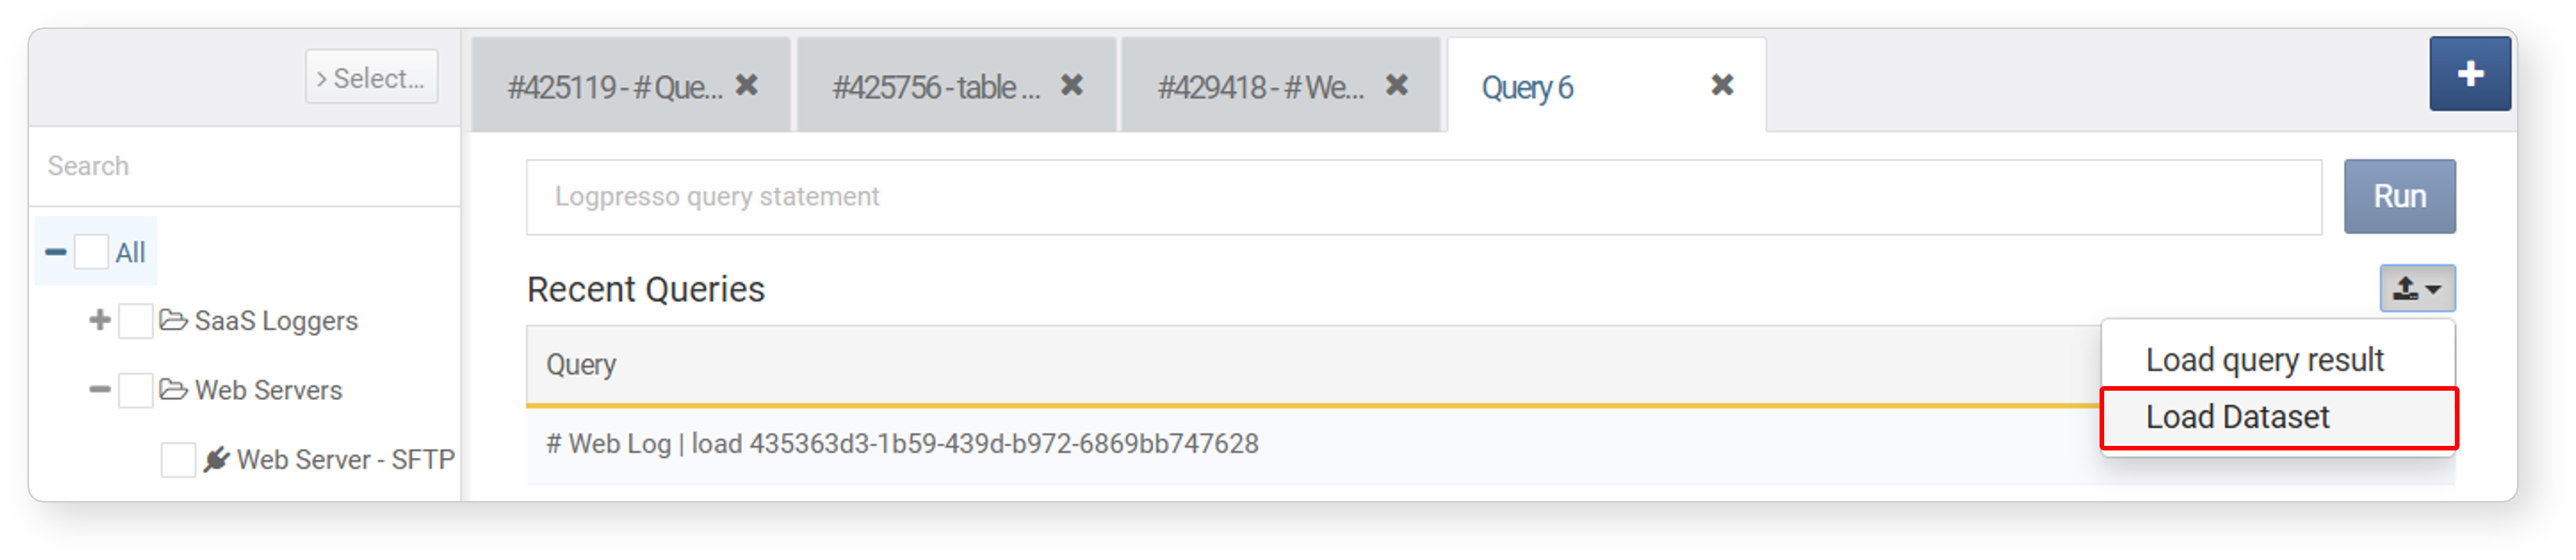
Click the Load icon
 at the top right of the new tab screen.
 -
Click Load Query Result from the context menu.
-
In the Load Query Result window, click the name of the desired query result.
-
The saved query results will be displayed in the tab screen.
-
To delete a query result, check the checkbox next to the item in the query results list and click Delete at the top of the query results list.
Load Dataset
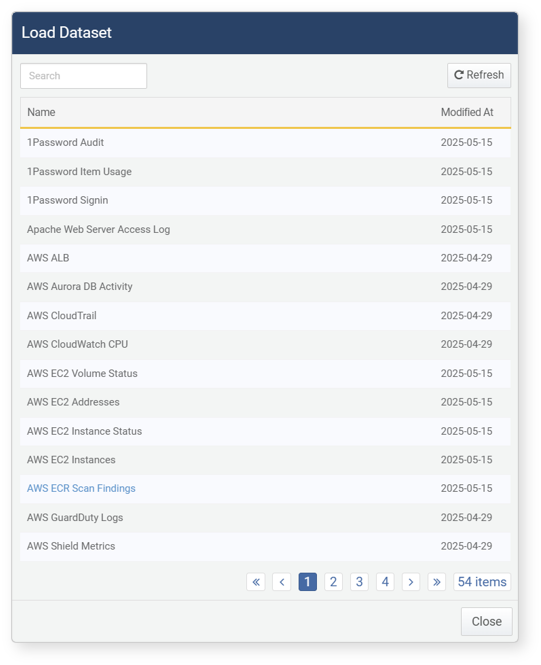
You can run and view the results of datasets saved from Events, Logs, Pivot, Datasets, and Queries. When loading a dataset, the associated query is re-executed at the time of loading, generating new results. To load a dataset:
-
Click the Load icon
at the top right of the new tab screen. -
Click Load Dataset from the context menu.
-
In the Load Dataset window, click the name of the desired query result.
-
The corresponding query will be executed immediately and displayed in a new tab. If no data matches the conditions defined in the dataset, no results will be shown.
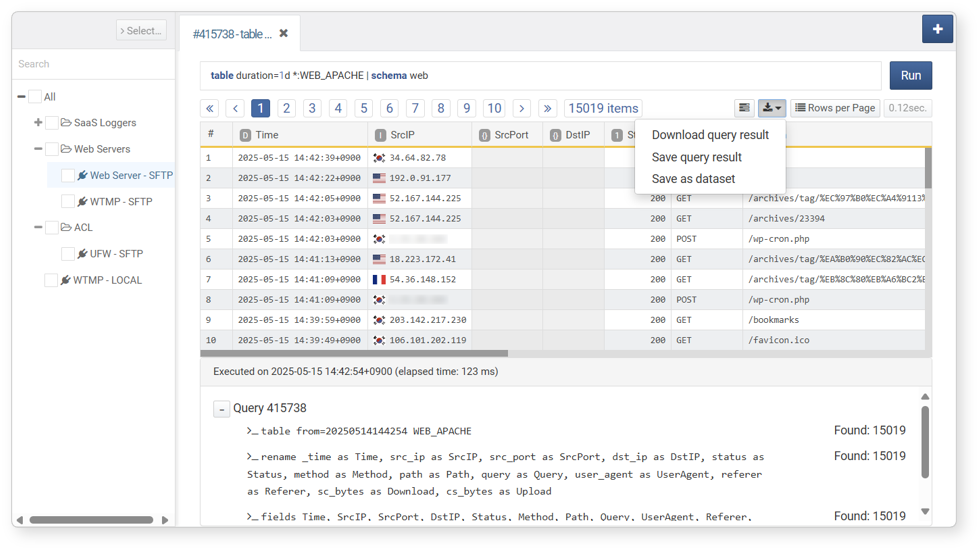
Save Query Result
Saving as a Dataset
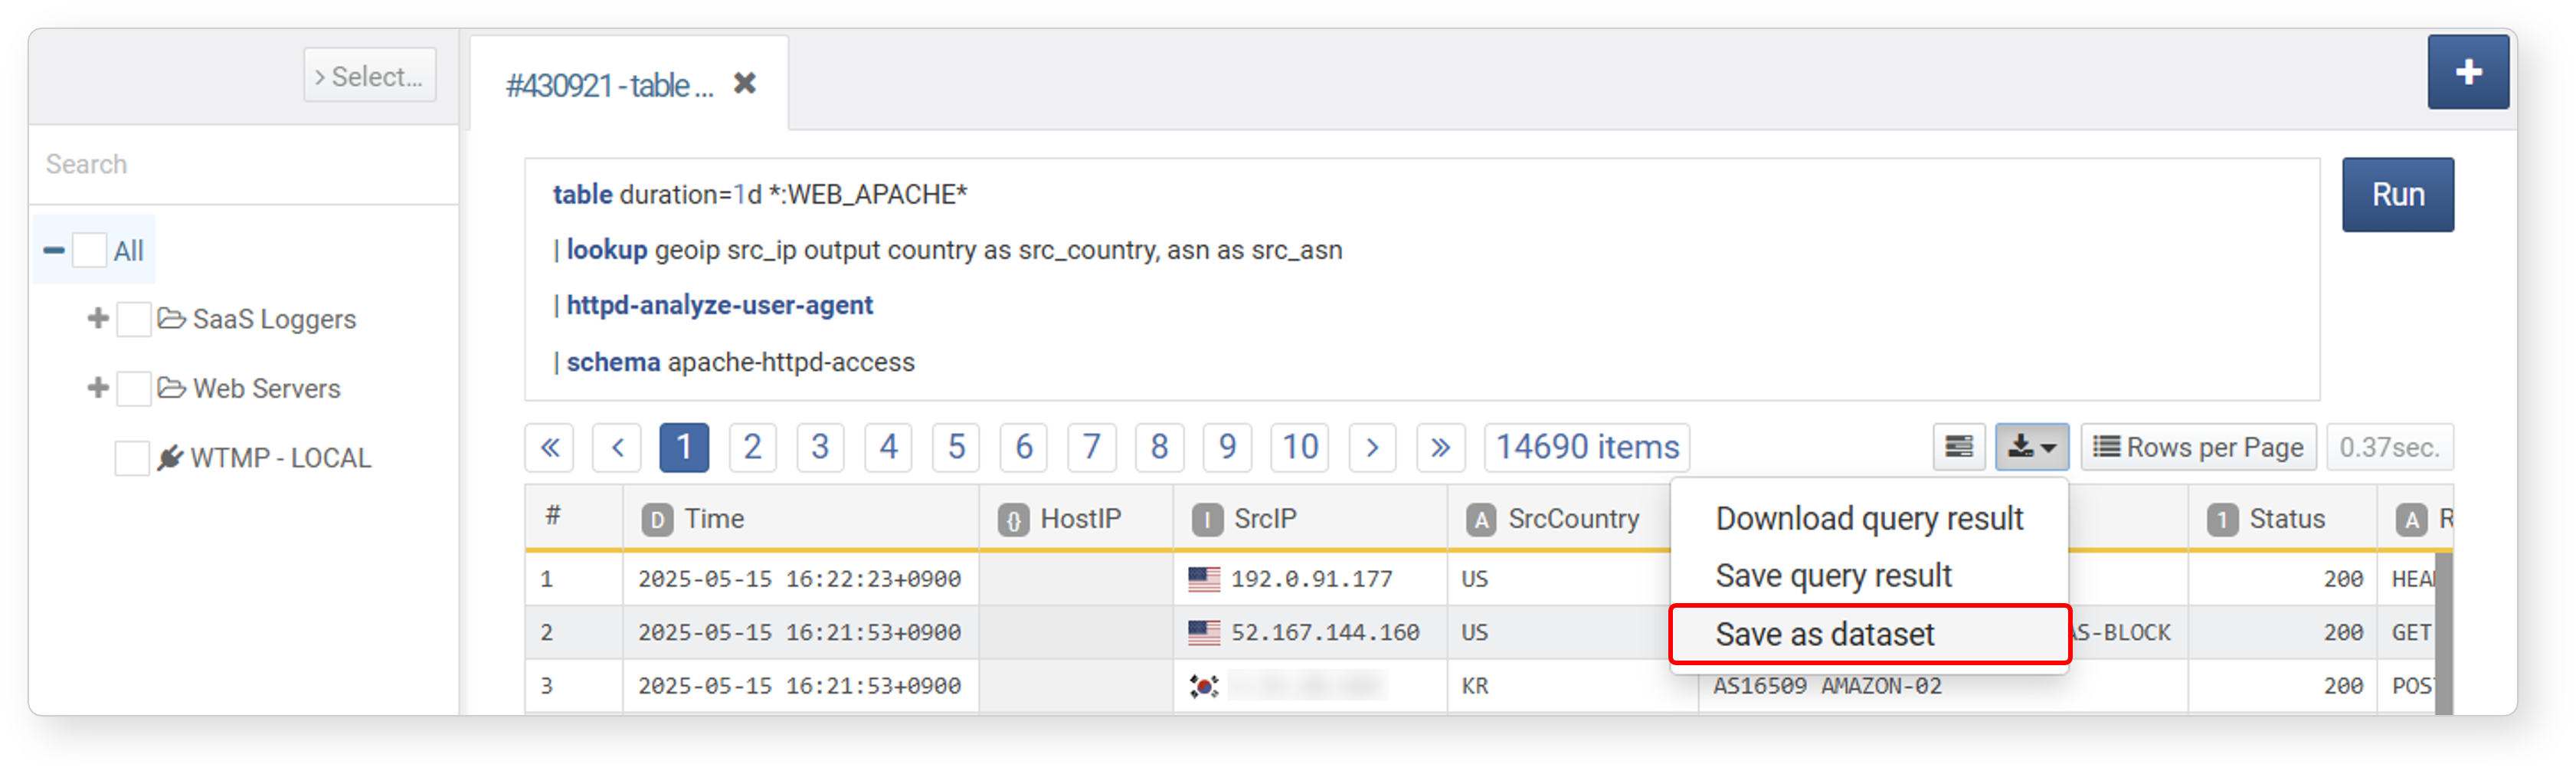
A dataset stores the query itself, not the result of a specific execution. When the dataset is accessed, it retrieves the most up-to-date data by re-running the query. To save a query result as a dataset:
-
Click
 icon in the toolbar.
 -
Select Save as Dataset from the context menu.
-
In the Add Dataset dialog, enter a Name and Description, then click Add. The saved dataset can be viewed in Analysis > Datasets.
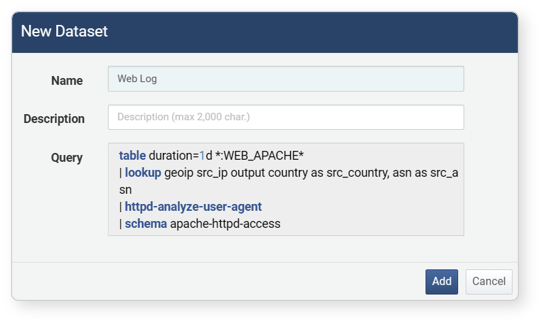
The saved dataset can be utilized in subsequent analysis tasks.
- In Analysis > Events, select the dataset as the Data Type and run a search.
- In Analysis > Pivot, select the dataset as the Data Type and run a search.
- Load the dataset in Analysis > Queries.
- In Dashboards > Widgets > Add Query Widget > Widget Editor, select the dataset as the Data Source and run a search.
- In Policies > Batch Rules, specify the dataset as the Analysis Method when adding a scenario
Saving Query Result
A query result refers to the output of a specific query execution identified by a Query ID. By saving a query result, you can view the saved data without having to rewrite the query. Saved results can be retrieved by Load Query Result.
-
Click
icon in the toolbar. -
Select Save Query Result from the context menu.
-
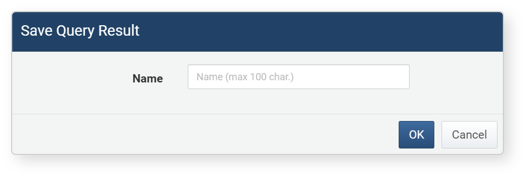
In the Save Query Result dialog, enter a name for saving and click OK. The query result data will be stored on the server and can be retrieved using Load Query Result.
Download Query Result
To download the results of a query execution as a file:
-
Click
icon in the toolbar. -
Click Download Query Result from the context menu.
-
In the Download Query Result dialog, enter or select the data properties, then click Download.
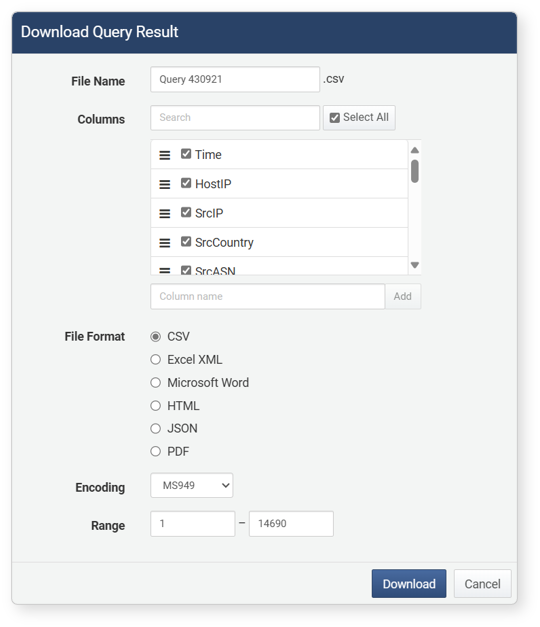
- File Name: The name of the file for the downloaded query execution results (default: Ticket)
- Columns: The data properties to be saved in the file. Clicking Select All will record all properties in the file.
- File Format: The format of the file to be downloaded (default: CSV)
- CSV: CSV file
- Excel XML: XML file viewable in Microsoft Excel
- Microsoft Word: DOCX file
- HTML: HTML file
- JSON: JSON file
- PDF: PDF file
- Encoding: File encoding (UTF-8, UTF-16 BE, MS949, default: MS949)
- Range: The number of logs to be recorded in the file. Only the specified number of logs will be recorded in reverse chronological order from the most recent logs.
- File Split: When this option is enabled, you can specify the Split Count, which defines how many query results to store in each file (default: Disabled, default split count: 100,000, minimum: 1,000). This option is supported from version 4.0.2409.0.
View Query Execution Information
In the query result screen, you can view the executed query, execution timestamp, elapsed time (in milliseconds), and the number of records processed at each stage. Click the  icon in the toolbar to display this information at the bottom of the screen.
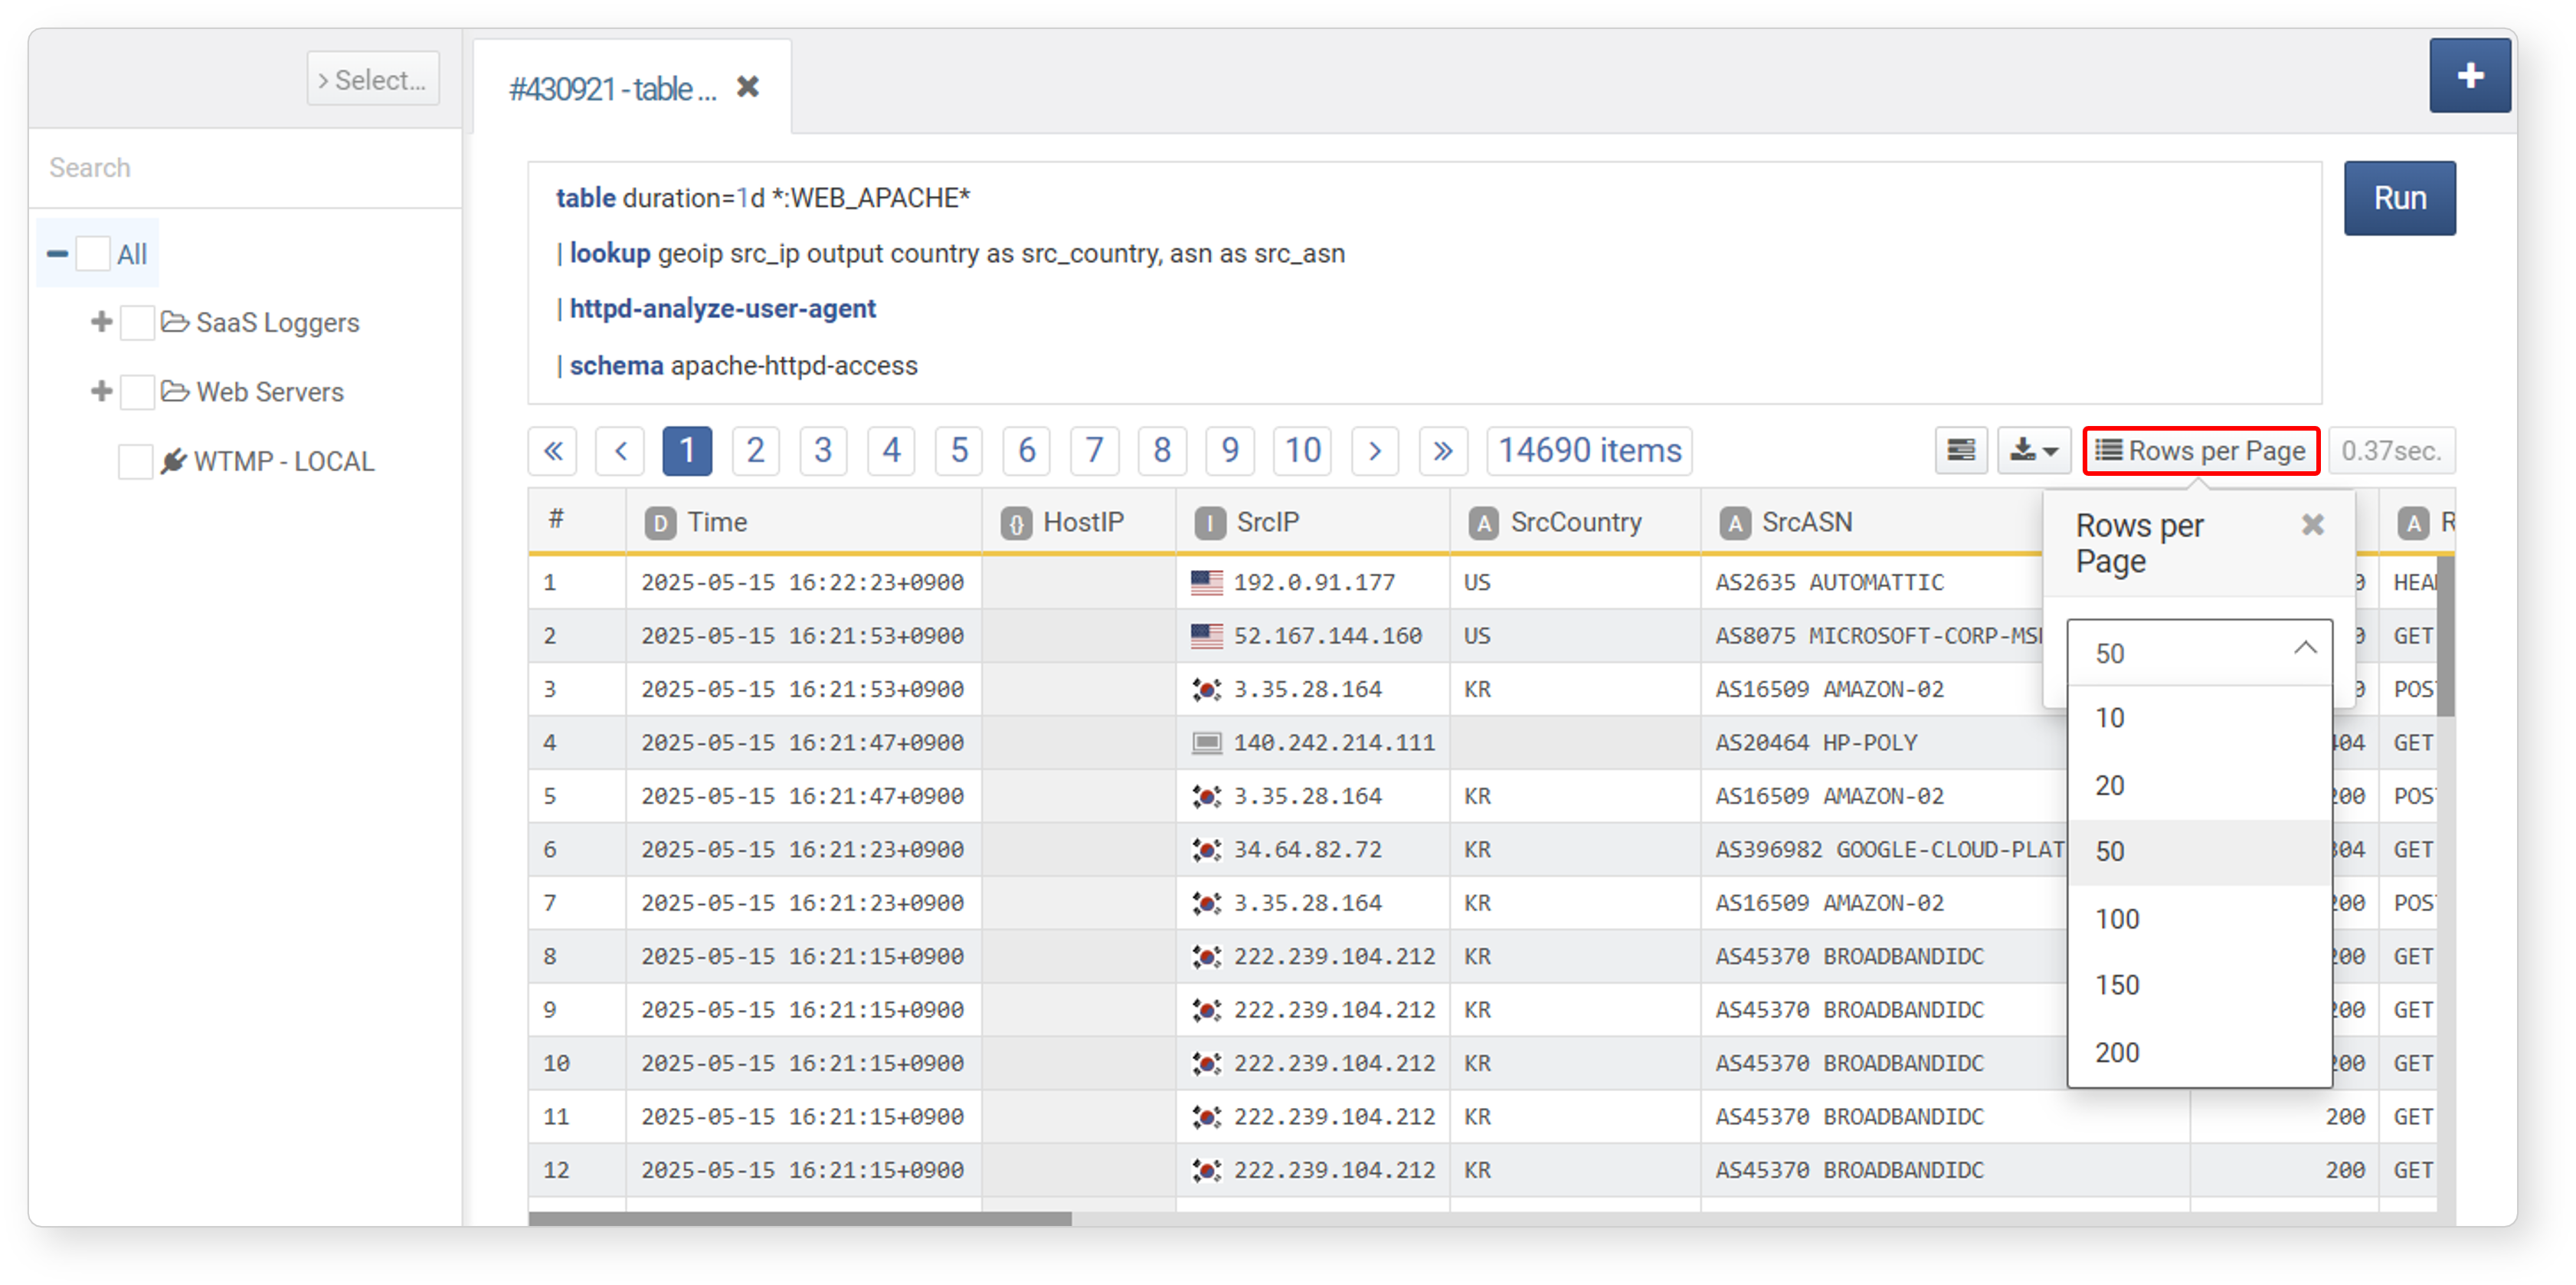
Change Number of Results Displayed
The query result list is paginated by default in sets of 50 records. To change the number of records displayed per page, click Rows per page in the toolbar on the query result screen and adjust the setting.