Event Summary
Overview
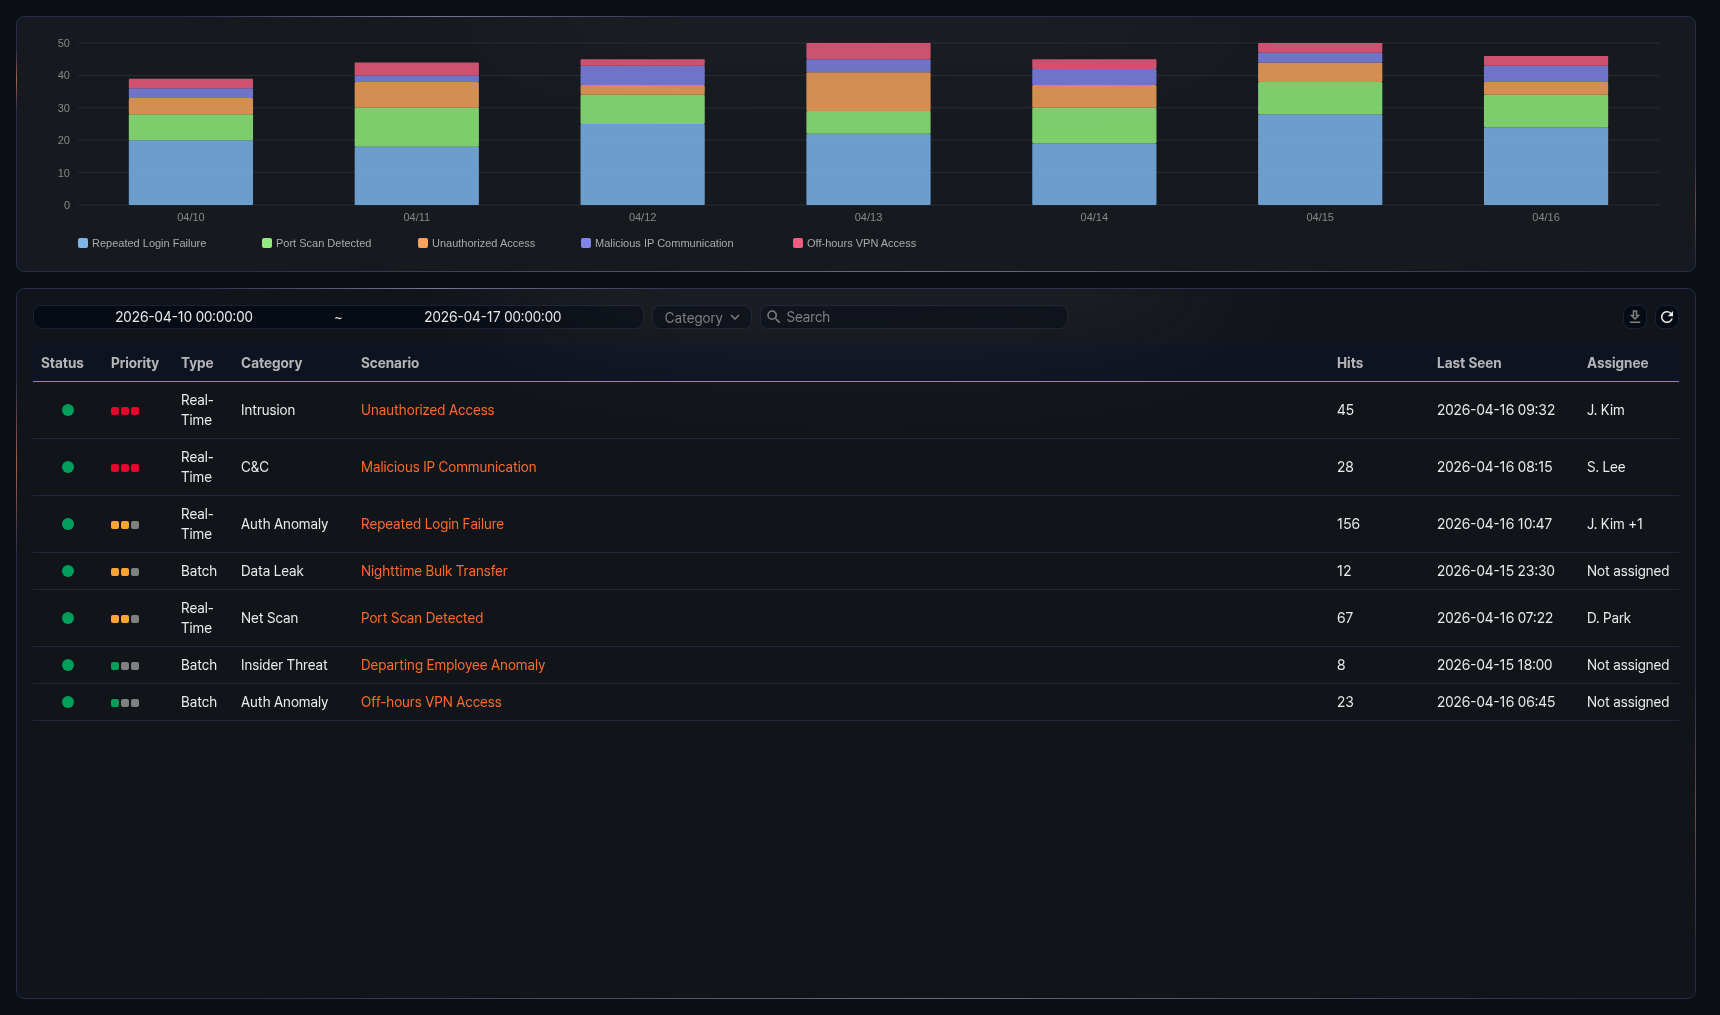
The Analysis > Event Summary page aggregates events generated by stream rules and batch rules at the scenario level. While the Events page lets analysts review individual detection records in chronological order, Event Summary provides a high-level view of detection counts and trends per scenario.
SOC analysts typically check Event Summary at the start of each shift to identify which scenarios have produced the most events over the previous day or recent period. When a particular scenario shows a sudden spike in detection count, analysts can click it to review the detailed events and, if necessary, check the progress of response tasks linked through tickets. Filtering by rule category helps separate detections by attack stage or threat type, making it easier to identify the most actively detected threat types across the organization.
Toolbar
The event summary list toolbar contains a date range filter, a category filter, and a search box for setting query conditions, along with ![]() and
and ![]() buttons for saving and refreshing the list. Changing any query condition updates both the chart and the list.
buttons for saving and refreshing the list. Changing any query condition updates both the chart and the list.

Date range filter
Use the date range filter to specify the query range based on event occurrence time. Enter the start and end dates directly or use the date picker. The default range is the last 7 days.
Category filter
Use the category filter to view only scenarios that belong to a specific rule category. The default is all categories.
Search
Enter a keyword in the search box to filter entries whose Scenario name contains the keyword. The search is not case-sensitive.
Download
To save the current event summary list to a file:
-
Click
 in the toolbar.
 -
In the Download Event Summary dialog, configure the options and click OK.
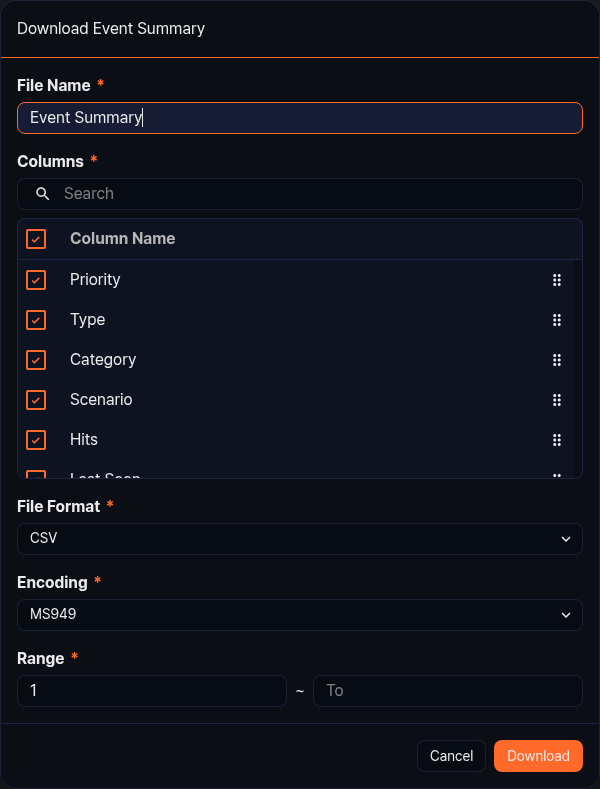
- Name: File name for the download (default: Event Summary).
- Columns: Select the columns to include in the file. Click Select All to include all columns. Available columns are Priority, Type, Category, Scenario, Hits, Last Seen, and Assignee.
- Format: File format for the download (default: CSV). Supported formats are CSV, Excel XML, Microsoft Word, HTML, JSON, and PDF.
- Encoding: File character encoding (default: UTF-8). Options are UTF-8, UTF-16 BE, and MS949.
- Range: Number of items to download. Items are saved starting from the most recent.
Refresh
To update the event summary with the latest data, click ![]() in the toolbar.
in the toolbar.
Event summary chart
The event summary chart visualizes the number of detected events per scenario over the query period as a stacked column chart.
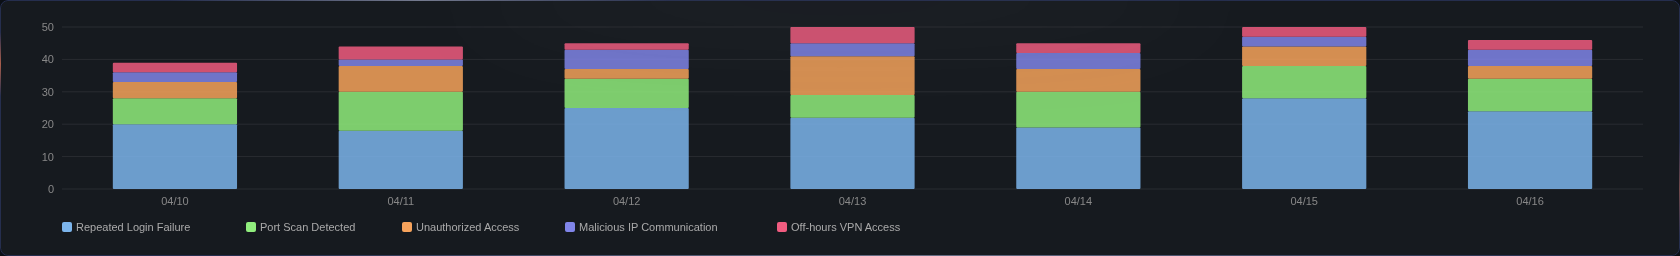
- X-axis: Time
- Y-axis: Detection count
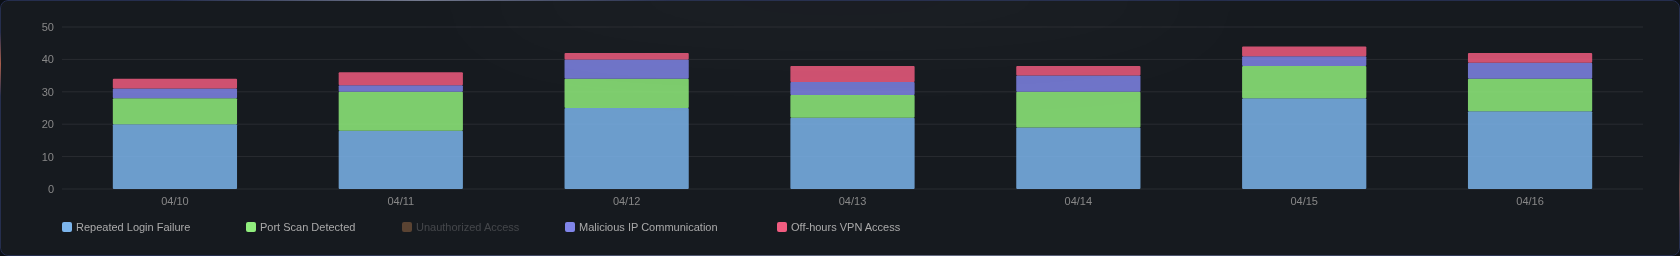
Click a scenario in the chart legend to toggle its visibility. This is useful when you want to focus on the trend of a specific scenario.
Event summary list
The event summary list shows scenarios that detected events during the query period. Scenarios with no detected events do not appear in the list.
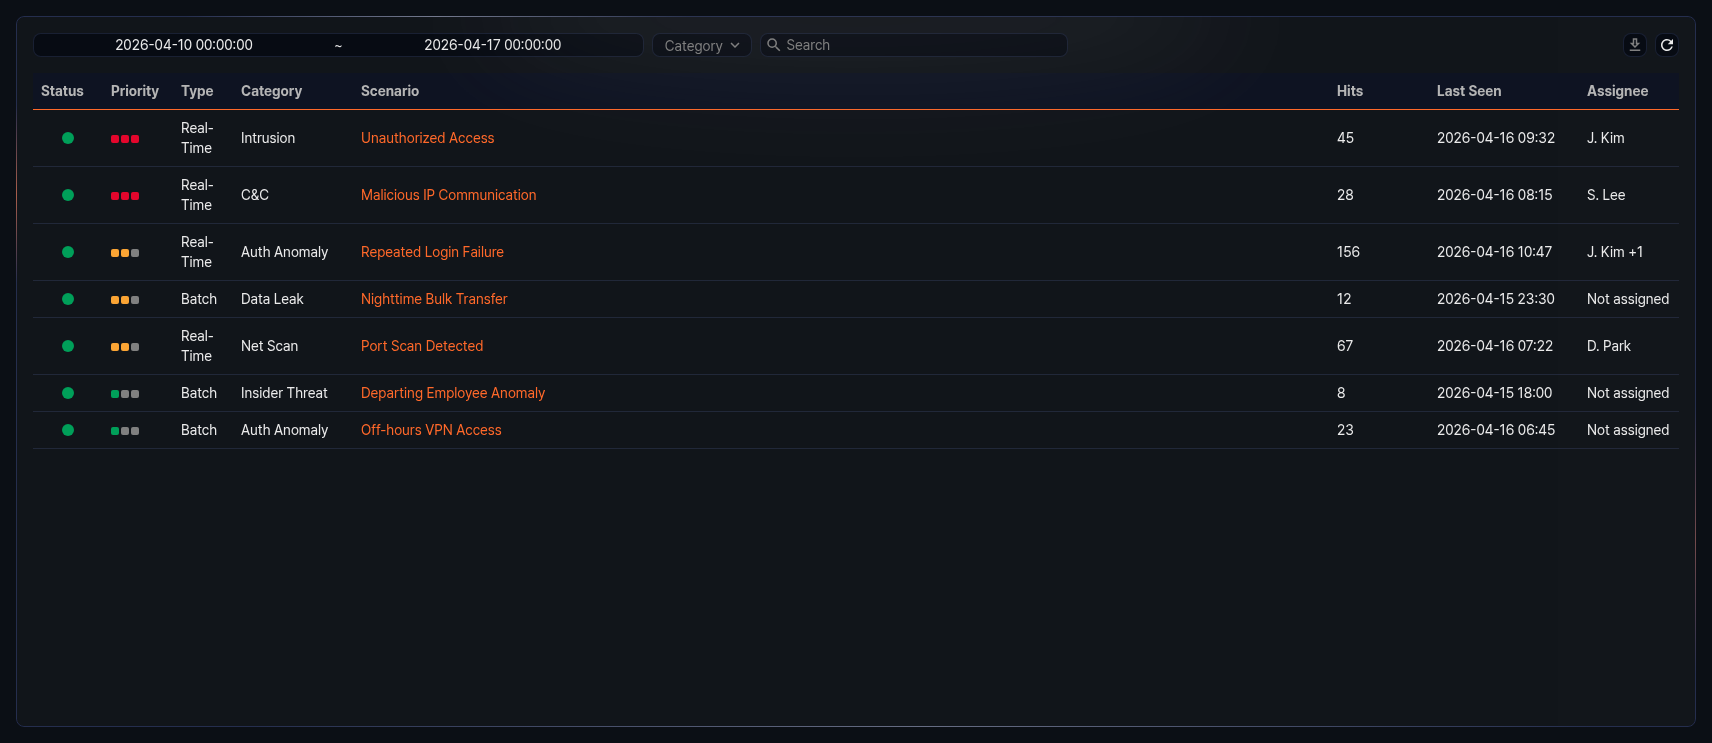
- Status: Activation status of the detection scenario. Only activated scenarios are shown.
- Priority: Event priority configured in the scenario (High/Medium/Low).
- Type: Type of detection scenario (Real-Time/Batch).
- Category: Rule category assigned to the scenario. Scenarios without a category show an empty value.
- Scenario: Name of the scenario that detected the event. Click to view the detailed events for that scenario.
- Hits: Number of events detected during the query period.
- Last Seen: Timestamp of the most recently detected event.
- Assignee: Assignee of tickets generated by the scenario. When there are multiple assignees, the first assignee and the remaining count are displayed. If no assignee is set, Not assigned is shown.
View event details
To view the detailed events detected by a specific scenario, click the scenario name in the event summary list. A new window displays the list of events detected by that scenario.
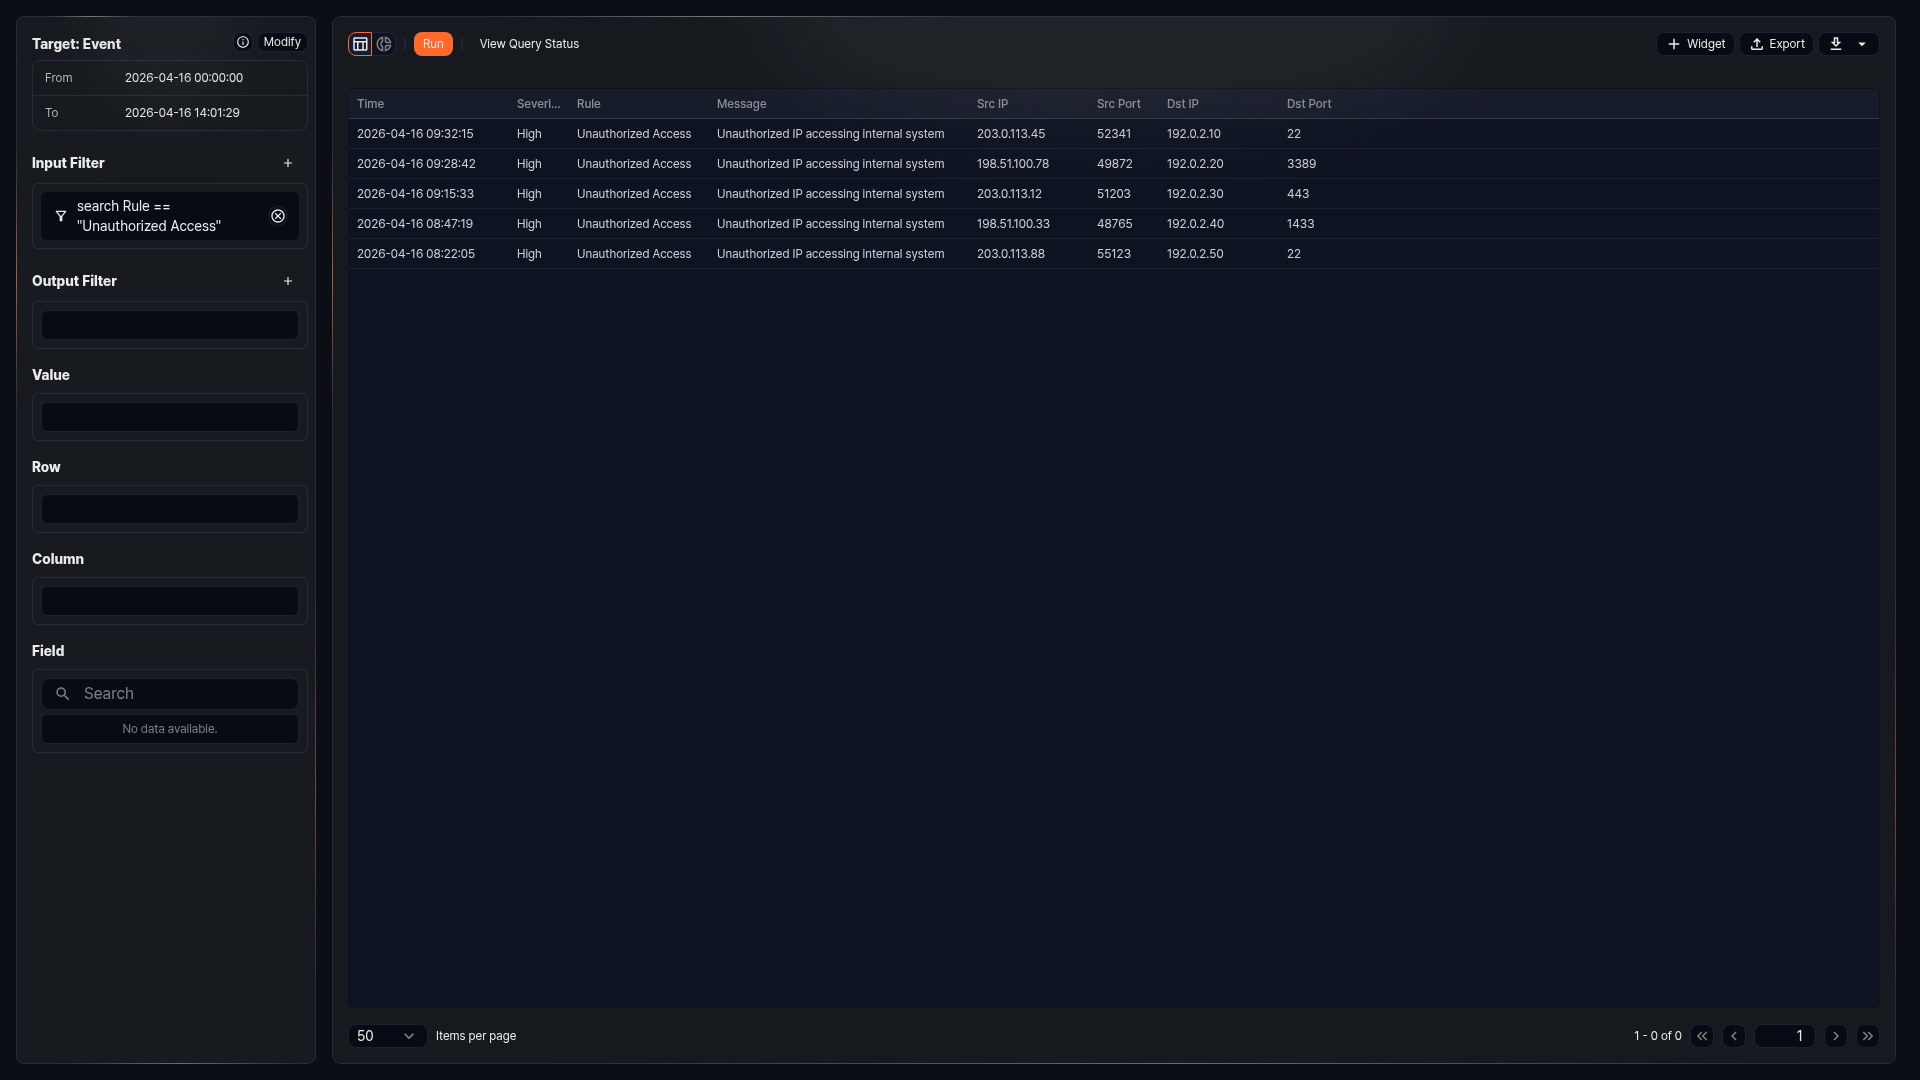
✅ The features available in this view are the same as those in the Events page.