Query widget
Overview
Query widgets visualize collected logs so that security operations analysts can immediately identify anomalous indicators on a dashboard. Clicking or dragging a chart or grid element can pass filters to other widgets or run related queries, enabling interactive dashboards where multiple widgets work together.
Editing query widgets requires an administrator account or an account with the dashboard management or widget editing permission. An account with only the widget viewing permission can view widget settings but cannot make changes. The widget editor is accessed from ![]() > Widgets on the dashboard. For information on creating widgets, see Widgets.
> Widgets on the dashboard. For information on creating widgets, see Widgets.
Widget editor
The query widget editor screen consists of a left panel and a right pivot table editor.
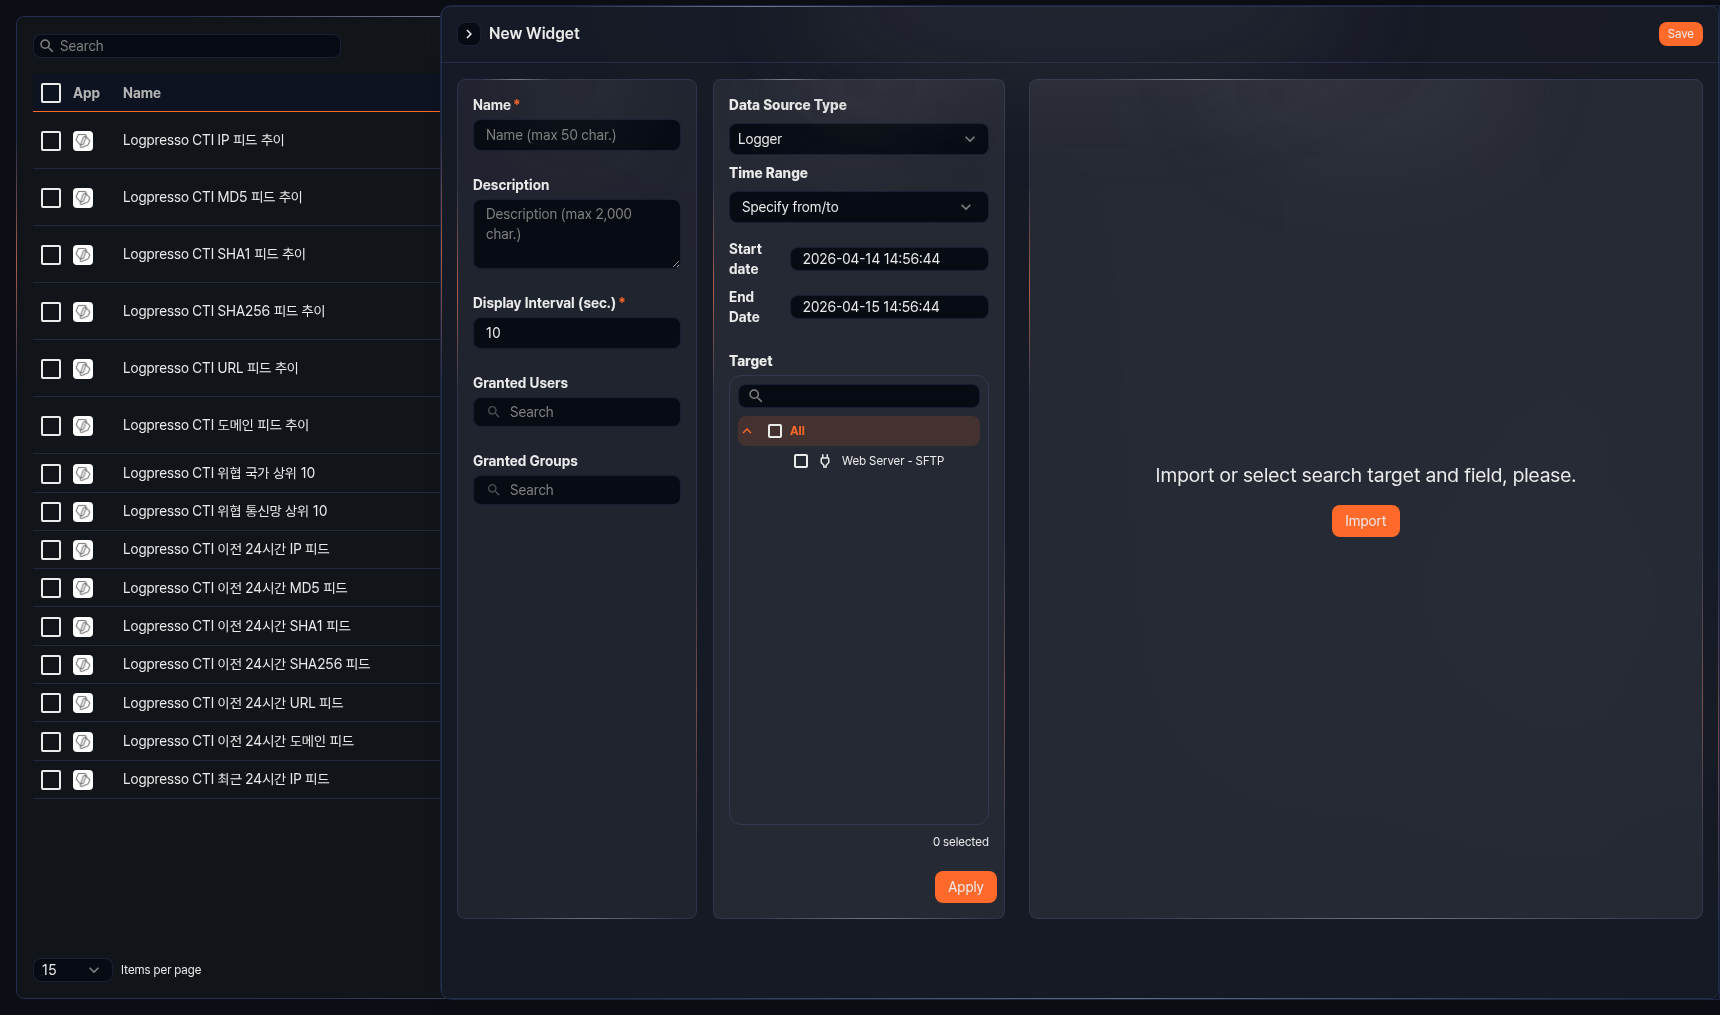
Basic settings
Set the basic widget information in the left panel.
- Name: Widget name (required, up to 50 characters)
- Description: Widget description (up to 2,000 characters)
- Display Interval: Interval at which the widget data is automatically refreshed (in seconds, required, range: 1–2,147,483)
- Granted Users: Select the accounts to share this widget with.
- Granted Groups: Select the account groups to share this widget with.
Data source and visualization
Select a data source and configure the visualization in the right pivot table editor. For instructions on using the pivot table editor, see Pivots.
Chart types
You can switch between ![]() grid view and
grid view and ![]() chart view in the pivot table editor. Grid displays query results in a table format. When you select chart view, you can choose one of the following chart types in the chart settings modal.
chart view in the pivot table editor. Grid displays query results in a table format. When you select chart view, you can choose one of the following chart types in the chart settings modal.
| Type | Description |
|---|---|
| Line | Line graph |
| Spline | Curved line graph |
| Area | Graph with the area below the line filled |
| Area (Spline) | Curved area graph |
| Stacked Area | Area graph with multiple series stacked |
| Stacked Area (Spline) | Curved stacked area graph |
| Bar | Horizontal bar graph |
| Stacked Bar | Horizontal stacked bar graph |
| Column | Vertical bar graph |
| Stacked Column | Vertical stacked bar graph |
| Scatterplot | Visualizes data distribution on X/Y coordinates |
| Pie | Displays proportions as a circle |
| Treemap | Displays hierarchical data as nested rectangles |
| Alert Box | Displays alert status when thresholds are exceeded |
| World Map (Marker) | Places markers on a map by latitude/longitude |
| World Map (Bubble) | Displays data on a map with bubble sizes by country |
Chart settings
All chart types except Grid use a chart settings modal to configure visualization options. The chart settings modal contains the following tabs:
| Tab | Description | Supported types |
|---|---|---|
| Variables | Set the fields used in the chart (independent variable, dependent variables) | All types |
| View | Zoom direction for selected area, how to connect empty values | Line series, bar series, scatterplot |
| Chart | Title, subtitle, background color, border | All types |
| Axis | X/Y axis title, display format, min/max values | Line series, bar series, scatterplot |
| Color Axis | Treemap color range settings | Treemap |
| Series | Series type, color, marker, border style | All types except treemap |
| Label | Whether to display value labels on all series | Line series, bar series, scatterplot |
| Legend | Whether to display the legend, layout, position | All types |
| Event | Click and drag event action settings | All types |
For detailed settings of each chart type, refer to the corresponding chart type page.
Event settings
Configuring events enables actions such as applying dashboard filters, running queries, and opening URLs when a user clicks or drags within a widget. Use events to link multiple widgets on a dashboard or build interactive dashboards that navigate to detailed analysis screens with a single click.
Events are configured on the Event tab of the chart settings modal.
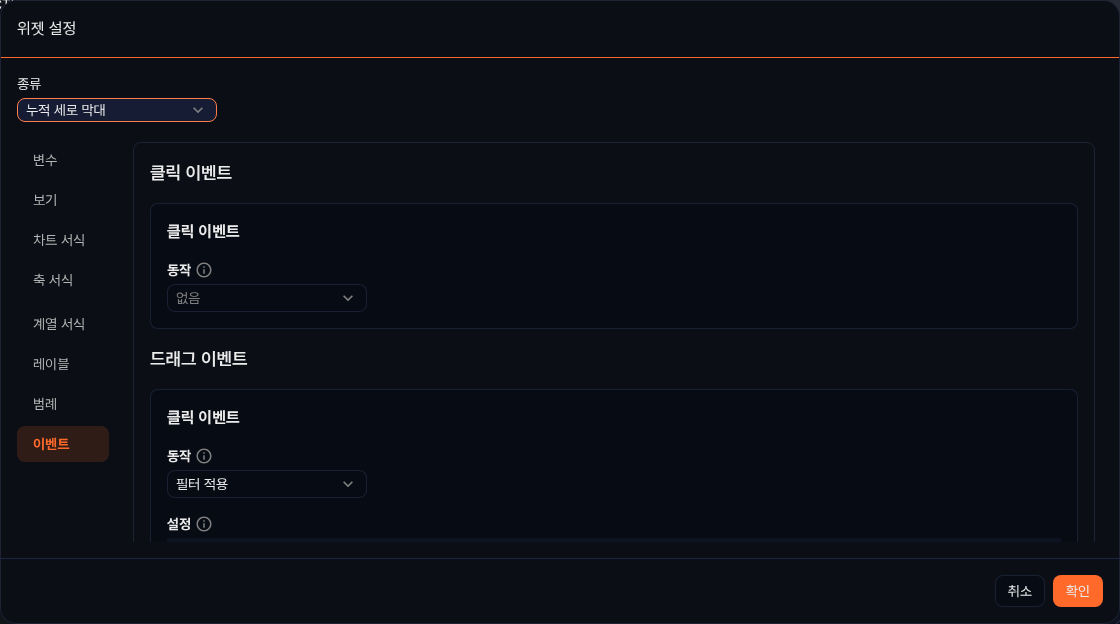
Event types
- On Click
- Fires when a user clicks an item in a chart or grid. Supports all actions: Apply Filter, Run Query, Open Web Browser, and Switch view.
- Drag
- Fires when a user drags a range on a chart. Available only on charts where the independent variable is a time type. Only the Apply Filter and Run Query actions are supported. The start time and end time of the drag range are provided as reserved words.
Apply Filter
When a click or drag event occurs, a dashboard filter is automatically added with the specified conditions. Click the + button to add a filter — you can add multiple filters to the same action.
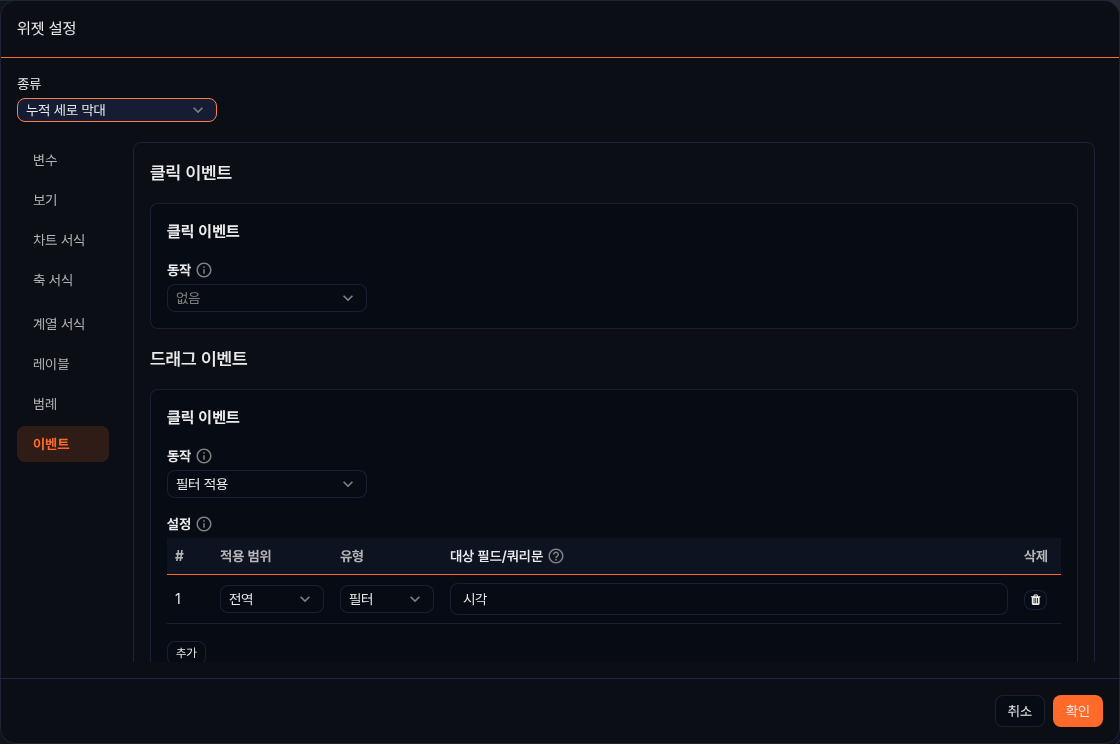
Each filter entry consists of Scope, Type, and Target Field/Query Statement.
- Scope
- Specifies the target to which the filter is applied.
- Global: Applies to all widgets on the dashboard.
- Dataset: Applies only to widgets that use the same dataset as this widget. Available only for dataset-based widgets.
- Type
- Specifies the format of the filter condition.
- Filter: Generates a comparison expression based on the field name entered in the target field. For click events, it creates a
search <field> == <clicked value>expression; for drag events, a time range expression is generated automatically. - Query: Enter a Logpresso query command directly in the query statement field. Reserved words in the query are replaced with actual values at execution time.
The following reserved words are available for the Query type:
On Click reserved words
| Reserved word | Description |
|---|---|
$series$ | Field name of the clicked item |
$field_name$ | Value displayed for that field (e.g., $src_ip$ → the src_ip value of the clicked row) |
Drag reserved words
| Reserved word | Description |
|---|---|
$xfield$ | Name of the time field |
$from$ | Drag start time |
$to$ | Drag end time |
Run Query
When a click or drag event occurs, a specified query runs in a new window. Enter the Logpresso query command to run in the Settings area.
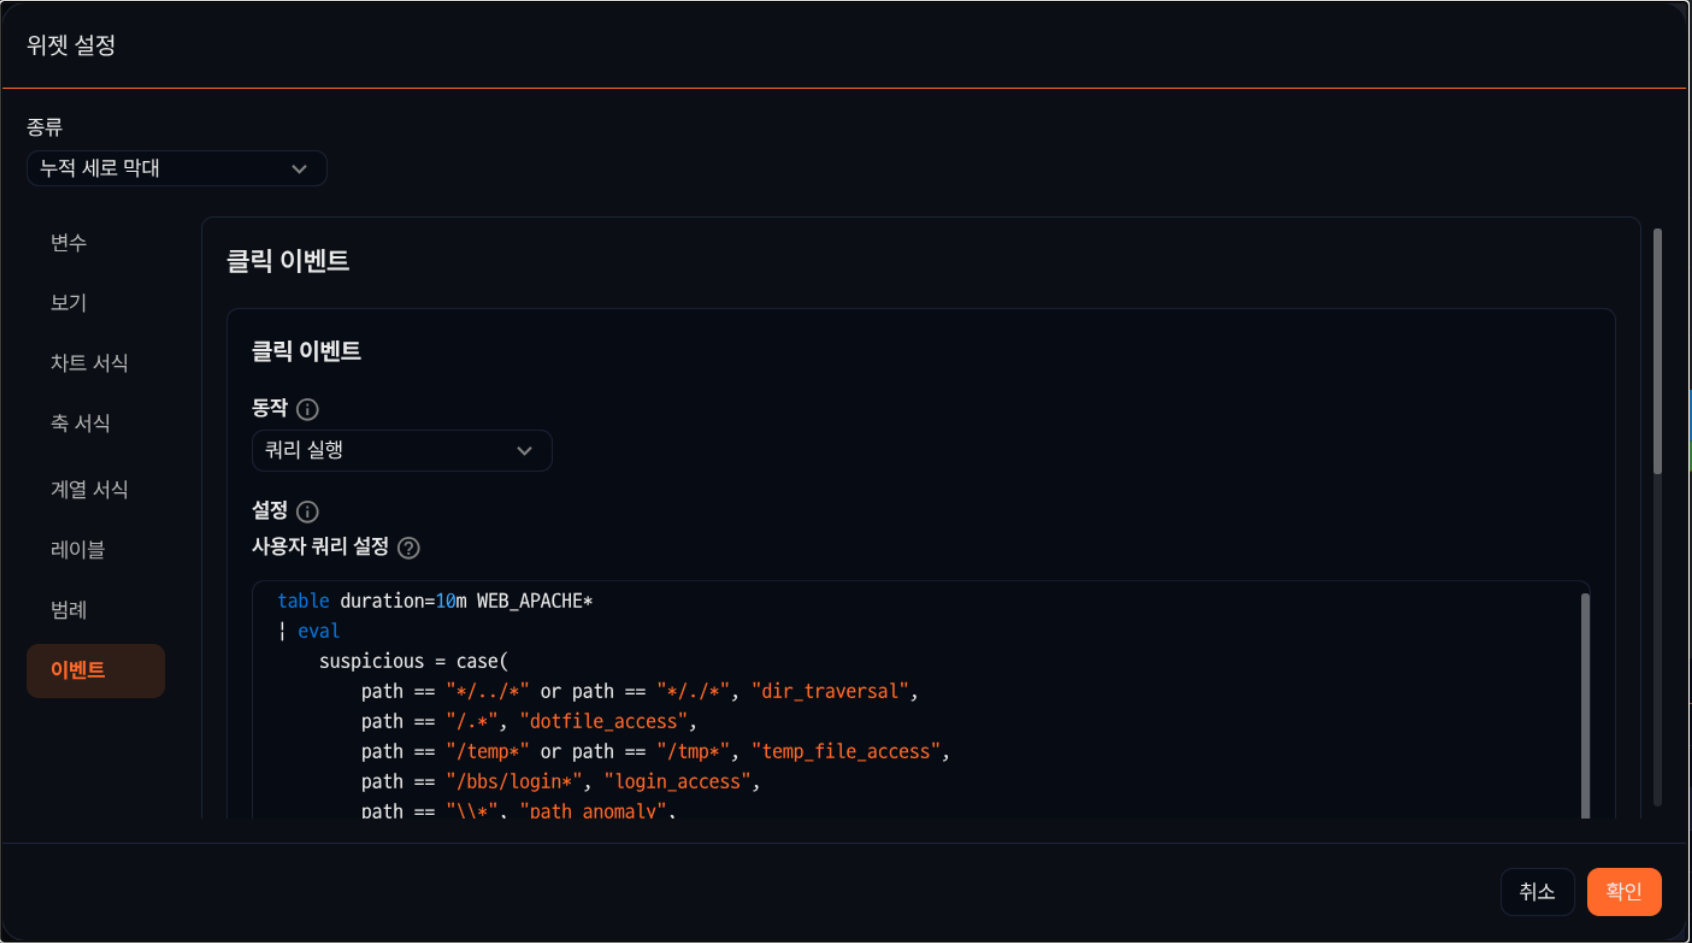
Reserved words in the query are replaced with actual values at execution time.
On Click reserved words
| Reserved word | Description |
|---|---|
$series$ | Field name of the clicked item |
$field_name$ | Value displayed for that field (e.g., $src_ip$ → the src_ip value of the clicked row) |
Drag reserved words
| Reserved word | Description |
|---|---|
$xfield$ | Name of the time field |
$from$ | Drag start time |
$to$ | Drag end time |
In an Alert Box widget, the reserved words $value$ (displayed value), $field$ (field name), and $threshold$ (threshold value) are also available.
Open Web Browser
When a click event occurs, the URL stored in the specified field opens in a new window. Select the field containing the URL value from the Fields with URLs dropdown. Available for click events only.
Switch view
When a click event occurs, the screen navigates to the specified URL path. Enter the destination URL directly in the Set Screen Navigation URL area. You can use reserved words in the URL to pass the clicked item's values as query parameters. Available for click events only.
| Reserved word | Description |
|---|---|
$field_name$ | Value of the corresponding field in the clicked chart or grid item |
$series$ | Field name of the clicked item |
In an Alert Box widget, the reserved words $value$ (displayed value), $field$ (field name), and $threshold$ (threshold value) are also available.