MITRE ATT&CK
Overview
MITRE ATT&CK (Adversarial Tactics, Techniques, and Common Knowledge) is an industry-standard framework that systematically classifies adversary tactics and techniques observed in real-world cyberattacks. Tactics represent adversary objectives (e.g., initial access, execution, persistence, privilege escalation), and techniques represent the specific methods used to achieve those objectives.
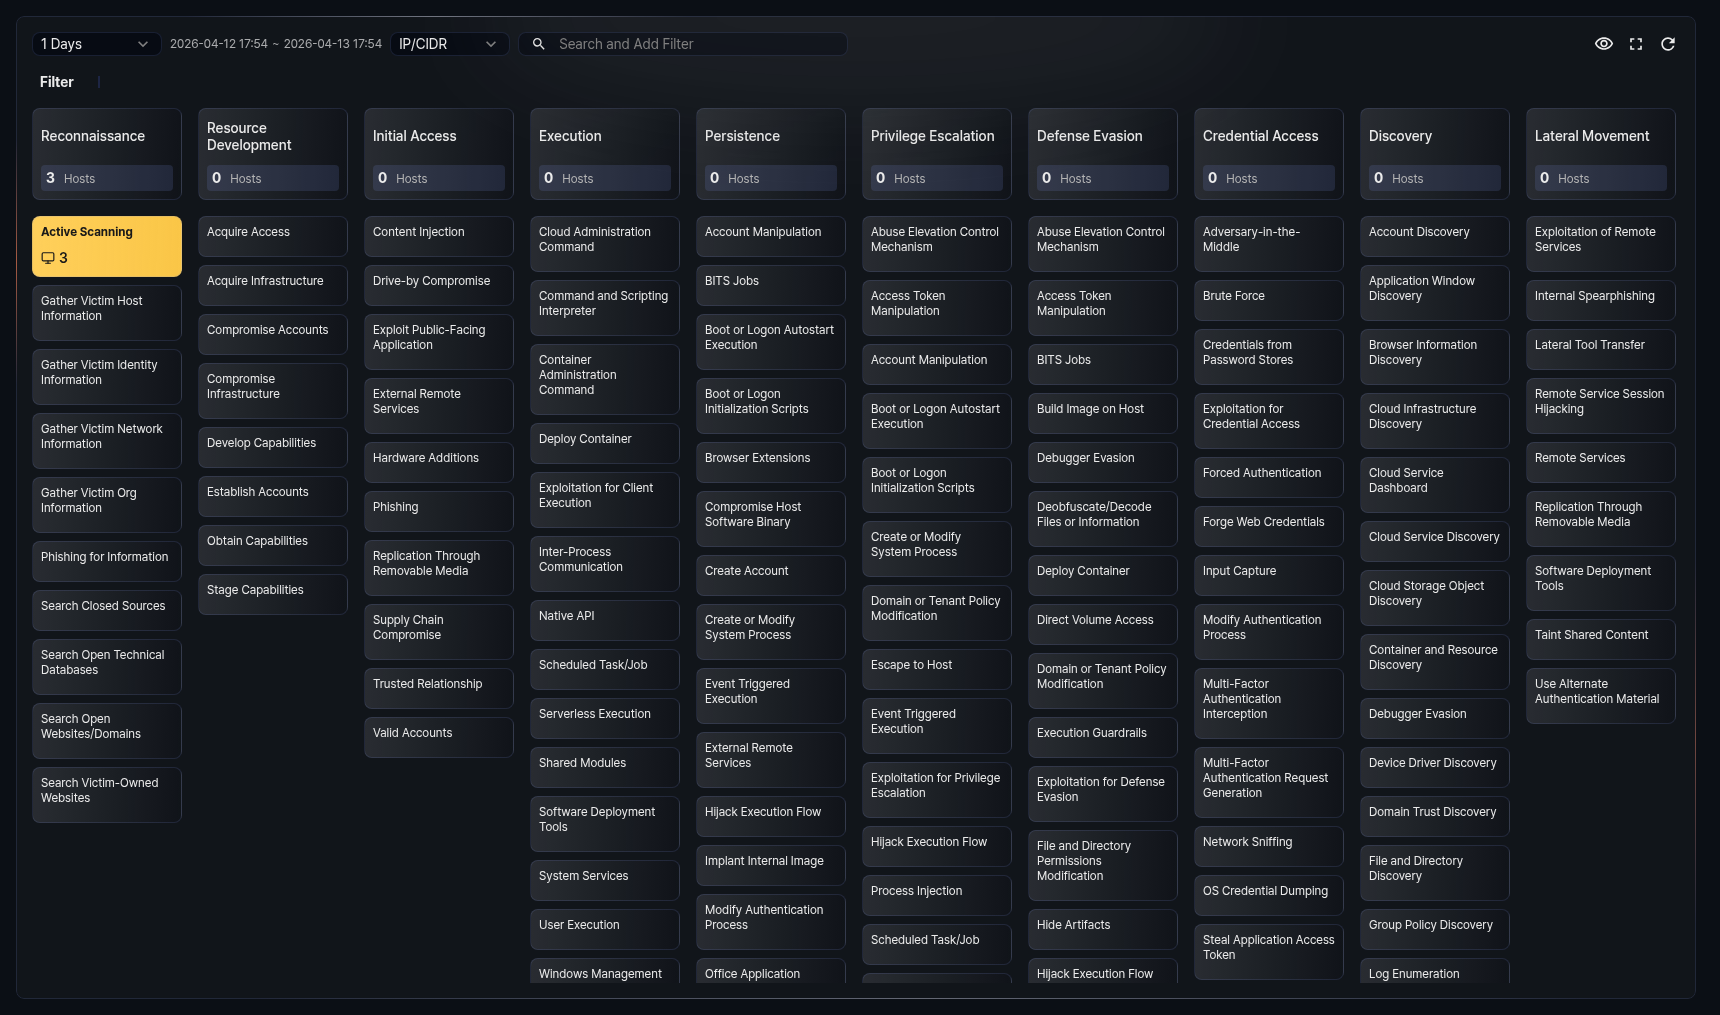
In the Sonar web console, navigate to Analysis > MITRE ATT&CK to view detected events in a MITRE ATT&CK matrix format. The matrix arranges tactics as columns and displays techniques belonging to each tactic as cards. Each technique card shows the number of hosts where events related to that technique were detected, and the card color indicates the severity level based on the host count. Click a technique card to view its details.
Events displayed in the matrix originate from stream rule and batch rule scenarios. You can map MITRE ATT&CK tactics and techniques to each detection scenario. When a scenario detects an event, the tactic and technique information is automatically tagged to that event. The matrix aggregates these tagged events and visualizes detection status by tactic and technique.
This menu is available to accounts with user-level access or higher.
Viewing the matrix
Navigate to Analysis > MITRE ATT&CK to view the MITRE ATT&CK matrix. The matrix refreshes automatically every 60 seconds.
Toolbar
The toolbar at the top of the matrix provides controls for setting query conditions.

- Date Range: Select the event date range. The default is 24 hours. You can choose from 1 hour, 1 day, 7 days, or 30 days. Based on the selected range, events from the current time back to the specified period are displayed. The actual time range applied is shown to the right of the selector.
- Search type: Select the keyword type for the filter: IP/CIDR or Hostname. The default is IP/CIDR.
- Search field: Enter keywords matching the search type and press Enter to add a filter. You can enter multiple keywords separated by spaces. If the keyword format is invalid, an error message is displayed.
The following buttons are available on the right side of the toolbar:
 Fit to screen: Displayed only in full-screen mode. Automatically adjusts the matrix column width to fit the screen width. Click again to restore the original width.
 Hide/Show: Toggles the visibility of technique cards with no events. When enabled, technique cards with zero hosts are hidden, showing only detected techniques.
 Full screen: Switches the matrix to full-screen mode. Click again to restore the original size.
 Refresh: Refreshes the matrix with the latest data.
Filters
When you enter keywords in the toolbar, a filter area appears below the toolbar. Added filters are displayed as tags. You can combine IP addresses and hostnames for filtering.

- To remove a specific filter, click the filter tag.
- To remove all filters at once, click the Delete all button.
When filters are applied, only events related to the specified IP addresses or hostnames are reflected in the matrix.
Tactic cards
At the top of each column in the matrix, a tactic card is displayed. The tactic card shows the tactic name and the number of hosts where events belonging to that tactic were detected.
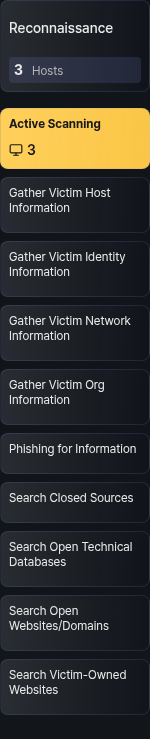
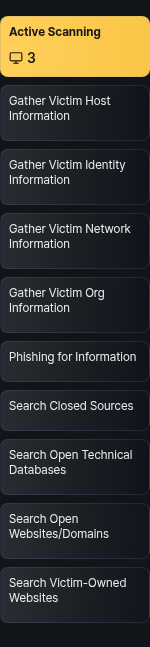
Technique cards
Below each tactic card, technique cards belonging to that tactic are listed. Each technique card shows the technique name and the number of hosts where events were detected.
The background color of technique cards indicates the severity level based on the number of detected hosts:
| Hosts | Severity | Color |
|---|---|---|
| 1--3 | Low | Yellow |
| 4--9 | Medium | Orange |
| 10+ | High | Red |
If the host count is 0, no background color is applied. When a new event is detected, the corresponding technique card blinks to indicate the change.
Technique details
Click a technique card in the matrix to open a detail panel on the right side of the screen.
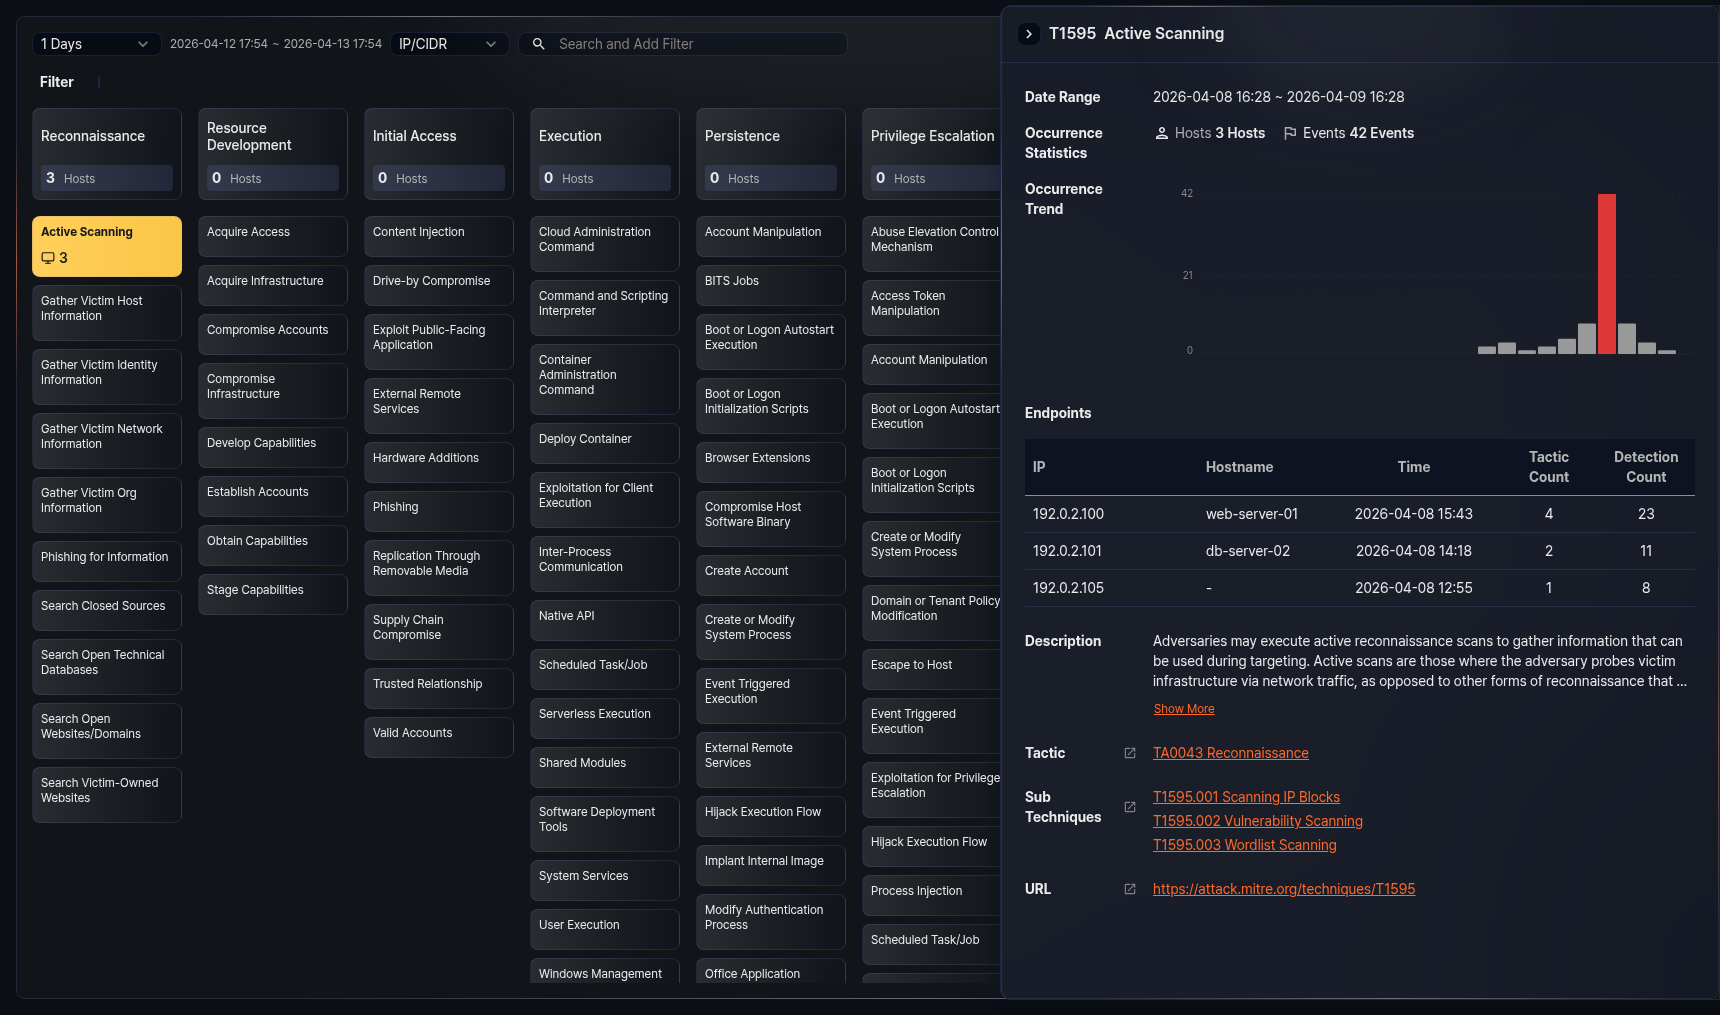
The top of the detail panel shows the technique's MITRE ID and name. The panel provides the following information:
- Date Range: Displays the date range set in the matrix.
- Occurrence Statistics: Shows the number of detected hosts and event count related to the technique.
- Occurrence Trend: Displays the event trend within the date range as a bar chart. The X-axis represents time and the Y-axis represents event count. The bar with the highest event count is highlighted in red. The chart time unit adjusts automatically based on the date range (1 day or less: 1 hour, 7 days or less: 1 day, 30 days or less: 1 day, over 30 days: 1 week).
- Endpoints: Shows a table of endpoints where events related to the technique were detected. Up to 15 entries are displayed.
- Description: The technique description provided by MITRE ATT&CK. By default, up to 3 lines are shown. Click Show More to view the full content, and click Show Less to minimize it again.
- Tactics: Lists the tactics to which the technique belongs. A single technique can belong to multiple tactics. Click a tactic name to open the corresponding tactic page on the official MITRE ATT&CK site in a new window.
- Sub Techniques: Lists the sub-techniques of the technique. Displayed only when sub-techniques exist. Click a sub-technique name to open the corresponding sub-technique page on the official MITRE ATT&CK site in a new window.
- URL: A link to view detailed information about the technique on the official MITRE ATT&CK site.
To close the detail panel, click the close button at the top-left of the panel or press Esc.
Endpoint table
The endpoint table provides the following information:
| Field | Description |
|---|---|
| IP | The IP address of the endpoint |
| Hostname | The hostname of the endpoint. Displayed as - if no hostname is available. |
| Time | The time when the last event was detected on the endpoint |
| Tactic Count | The number of unique tactics detected on the endpoint |
| Detection Count | The total number of events detected on the endpoint |
If there are more than 15 endpoints, a Show All button appears at the bottom of the table. Click this button to run a query that retrieves the full endpoint list in a new window.
IP address action menu
Click an IP address in the endpoint table to display an action menu for that IP.
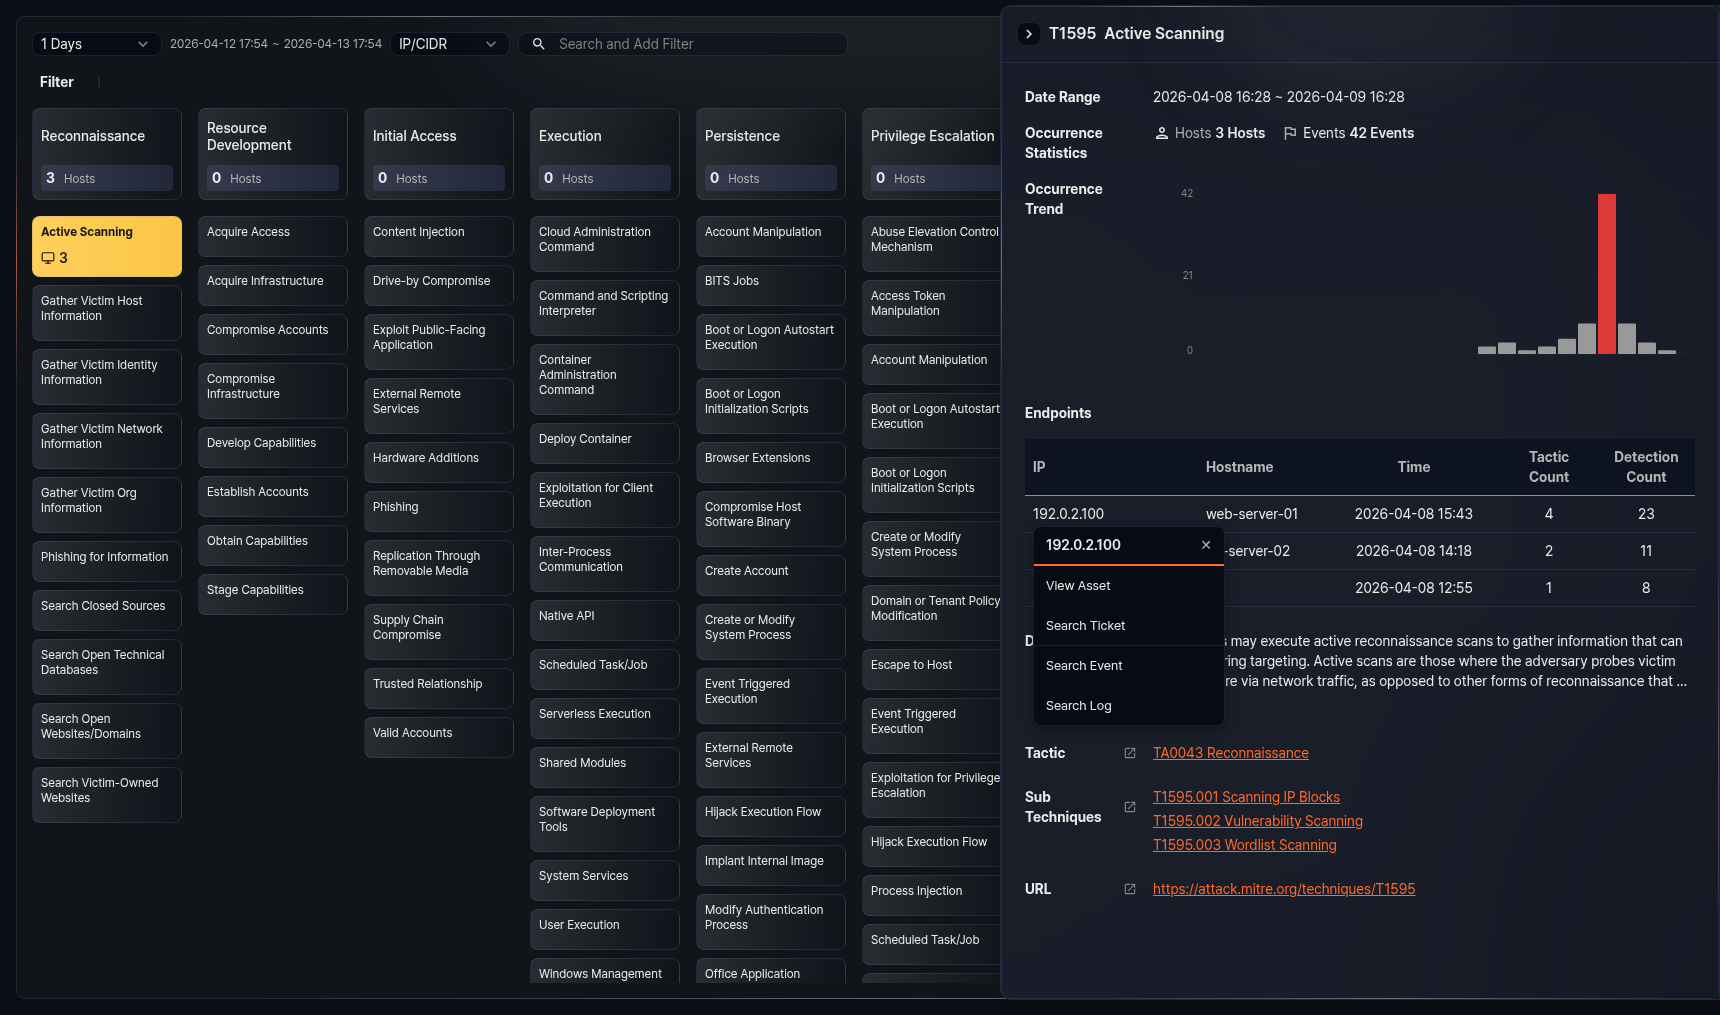
- View Asset: Navigates to the Assets detail page for the IP. Displayed only when asset information is registered.
- Search Ticket: Opens a new window to search for tickets related to the IP.
- Search Event: Runs a query in a new window to retrieve events related to the IP.
- Search Log: Runs a query in a new window to retrieve raw logs related to the IP.