Reports
Overview
The report template creation and generation feature lets you produce scheduled reports, summarize analysis results, and create materials that support decision-making.
You can easily build customized reports using predefined templates. Reports are composed by processing data with queries and arranging the results into elements such as tables, charts, and text.
This feature helps automate repetitive reporting tasks and enables teams to share consistent, standardized analysis results quickly.
View and search report templates
You can view or search report templates under Analysis > Reports. The report group tree appears in the left sidebar. Drag the border between the group tree and the report list to adjust the sidebar width. Drag it far enough to the left to minimize the tree when group names are truncated, or when you want to expand the report list. When first opened, the tree shows only the top-level node expanded; click a node to expand its children when needed.
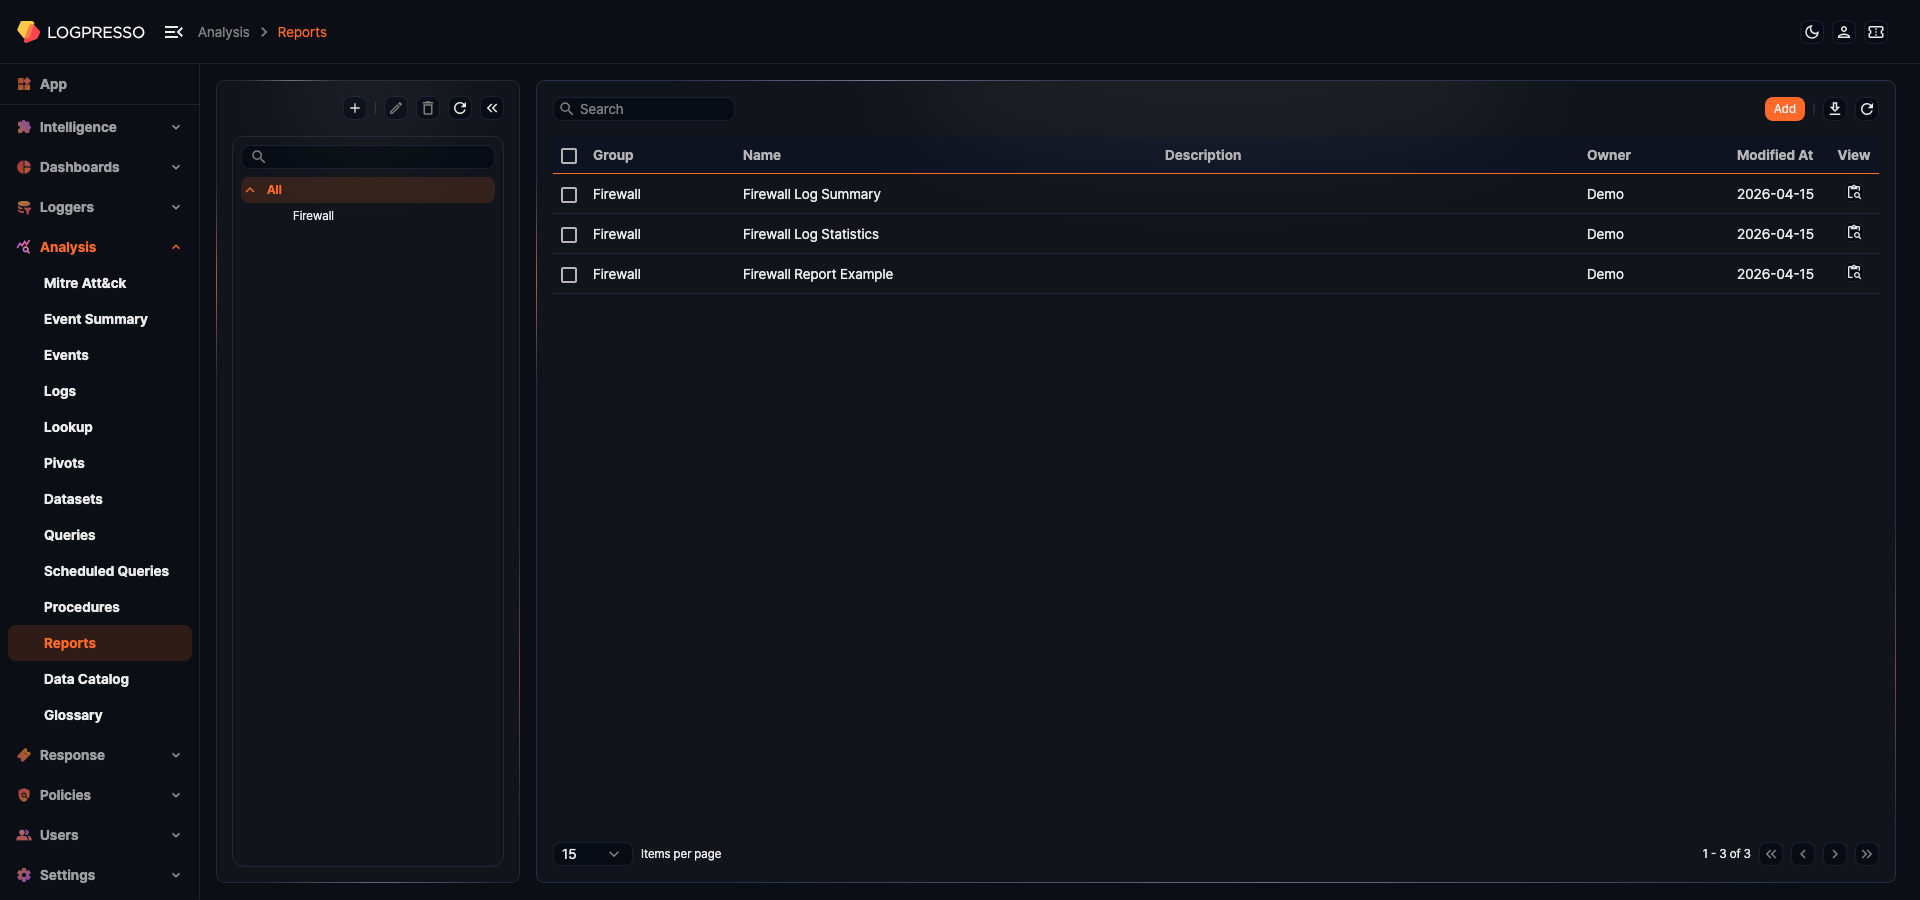
- Group: Classification group of the report (classification groups can be viewed and searched in the left tree panel)
- Name: Name of the report template
- Description: Description of the report template
- Owner: The account that created the report template
- Modified At: The date the report was last modified (
yyyy-MM-ddformat) - View: View the report for a specified date using the report template. This column is only displayed when the user has the Report Template Edit (
REPORT_TEMPLATE_EDIT) permission.
To find a specific report template, use the search tool in the toolbar. The search tool finds templates whose Name or Description contains the entered keyword. The search is not case-sensitive.
Create report template
To create a report template:
- Click Add in the toolbar of the report template list.
- Complete the Basic settings and Component settings, then click Save.
Basic settings
In the Basic settings section, configure the general information for the report.
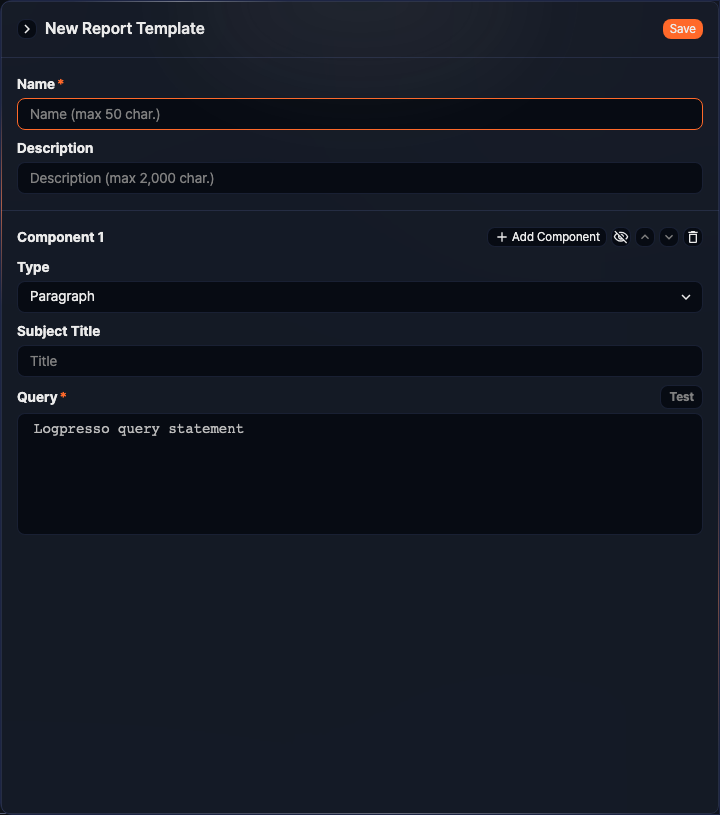
- Name: Name of the report template (required, up to 50 characters)
- Description: Description of the report template (up to 2,000 characters)
Component settings
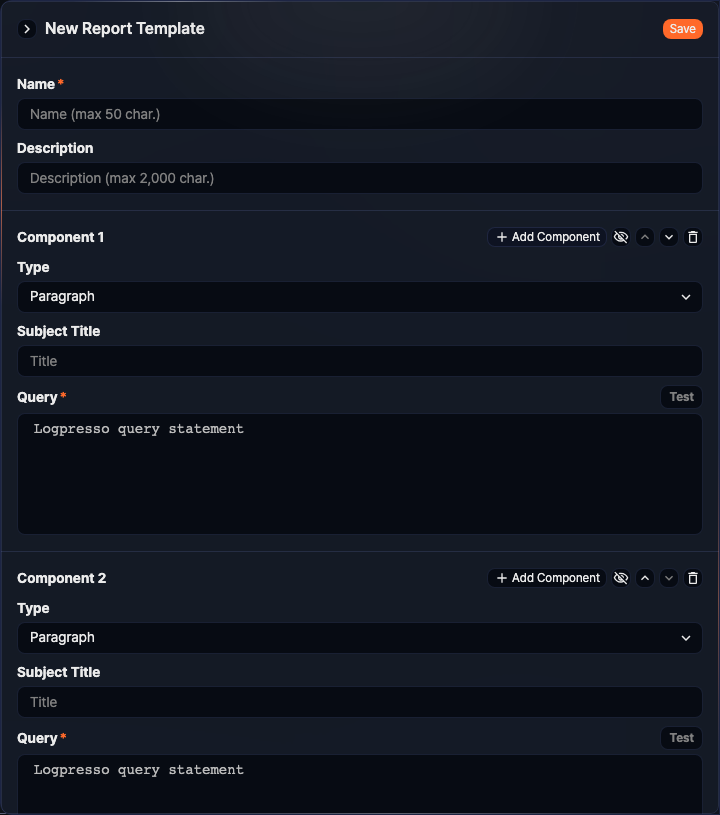
Add components to define the content of the report template. To add a component, click Add Component on the right side of an existing component, or click Add Component in the center of the screen when no components have been added yet.
- Type: The type of the component
- Paragraph: Inserts plain text into the report. The value of the
linefield from the query result is displayed as paragraph text. If multiple records are returned, each paragraph is rendered sequentially. - Grid: Inserts a table into the report. The query result is displayed as a table. The column order follows the order shown in the query result window, as specified by the
fieldsorordercommand. - Graph: Inserts a chart into the report.
- The chart automatically detects the independent variable field (X-axis) and dependent variable fields (Y-axis) from the query result.
- Independent variable field: The baseline field for the chart (timestamp, string, or IP address type fields)
- Dependent variable fields: Value fields to plot against the independent variable (integer or float type fields)
- The query result must contain exactly one field that can serve as the independent variable, and at least one field that can serve as a dependent variable.
- For pie charts, the dependent variable field must be exactly one.
- The chart automatically detects the independent variable field (X-axis) and dependent variable fields (Y-axis) from the query result.
- Memo: Inserts boxed text (memo) into the report. The value of the
linefield from the query result is displayed as memo text inside a bordered box. If multiple records are returned, each memo is rendered sequentially.
- Paragraph: Inserts plain text into the report. The value of the
- Chart: When the type is Graph, select the chart type. Available chart types are:
- Line: Displays changes over time as a line.
- Bar: Displays data as horizontal bars.
- Column: Displays data as vertical bars.
- Stacked Area: Stacks multiple series as filled areas.
- Pie: Displays proportions of a whole as a circular chart.
- Stacked Bar: Stacks multiple series as horizontal bars.
- Stacked Column: Stacks multiple series as vertical bars.
- Chart Options: When the type is Graph, configure chart display options. Available options vary by chart type.
- Log scale: Displays the Y-axis on a logarithmic scale. Available for Line, Bar, Column, Stacked Area, Stacked Bar, and Stacked Column charts.
- Percentage: Displays each data point as a percentage of the total. Available for Line, Bar, Column, Stacked Area, Stacked Bar, and Stacked Column charts.
- Donut: Displays the pie chart in donut form. Available for Pie charts only.
- Label: Displays value labels on each data point. Available for Bar, Column, Stacked Bar, Stacked Column, and Pie charts.
- Subject Title: The heading of the component. This appears as a subheading in the report and can be omitted if not needed.
- Query: The query used to retrieve data for this component (required, up to 10,000 characters).
- Use the
$("from")and$("to")parameters to retrieve time-bounded data. When generating a report, the query parametersfromandtodefine the target time range. - After entering a query, click Test to preview the results in a new window. The Test button is only active after a query has been entered.
- Use the
Toolbar
When building a report template, use the toolbar to manage individual components.
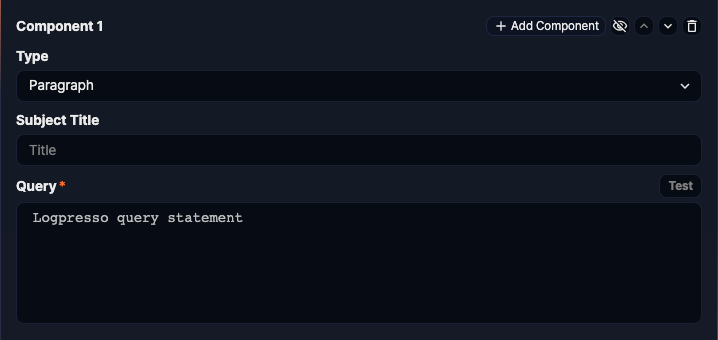
Toolbar actions, from left to right:
- Add Component: Adds a new component below the current one.
- Show/Hide: Toggles the visibility of the component in the generated report.
- Move up / Move down: Changes the position of the component up or down.
- Delete: Removes the component.
Edit report template
To modify an existing report template:
- Click the Name of the report template you want to edit in the report template list.
- Update the Basic settings and Component settings, then click Save. To discard changes, click the close button (
 ) at the top of the panel.
Generate and view reports
Viewing reports in the web console
You can view a report for any time period using an existing report template.
-
Click View for the desired report template in the report template list.
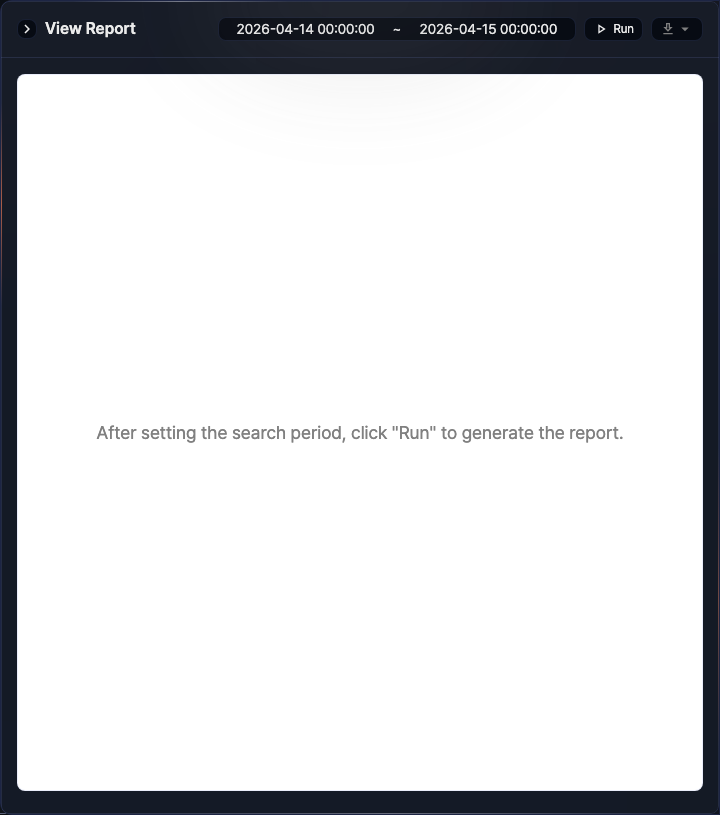
-
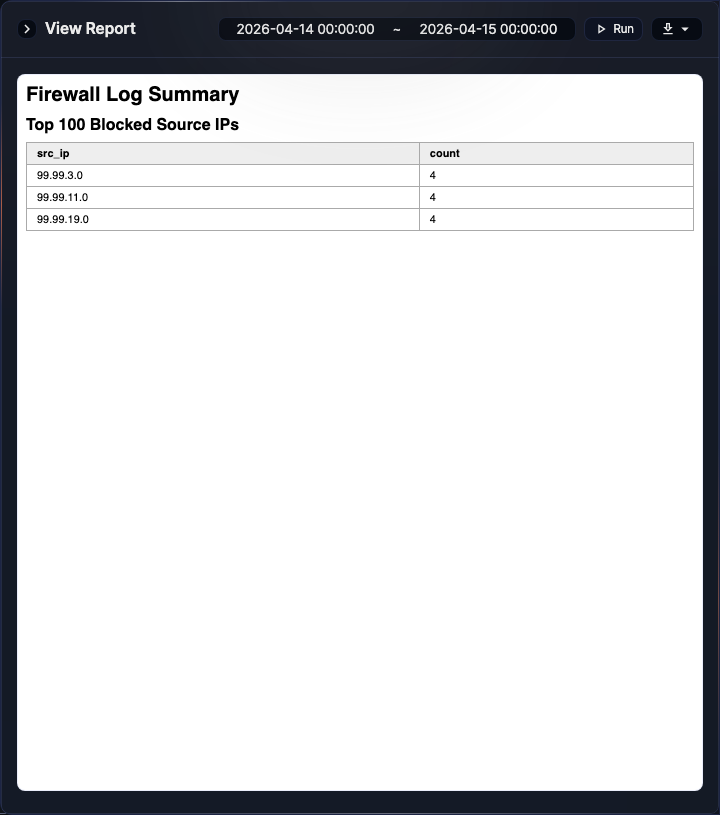
Set the target date at the top of the report view panel, then click Run. The report is generated and displayed in the preview pane.
-
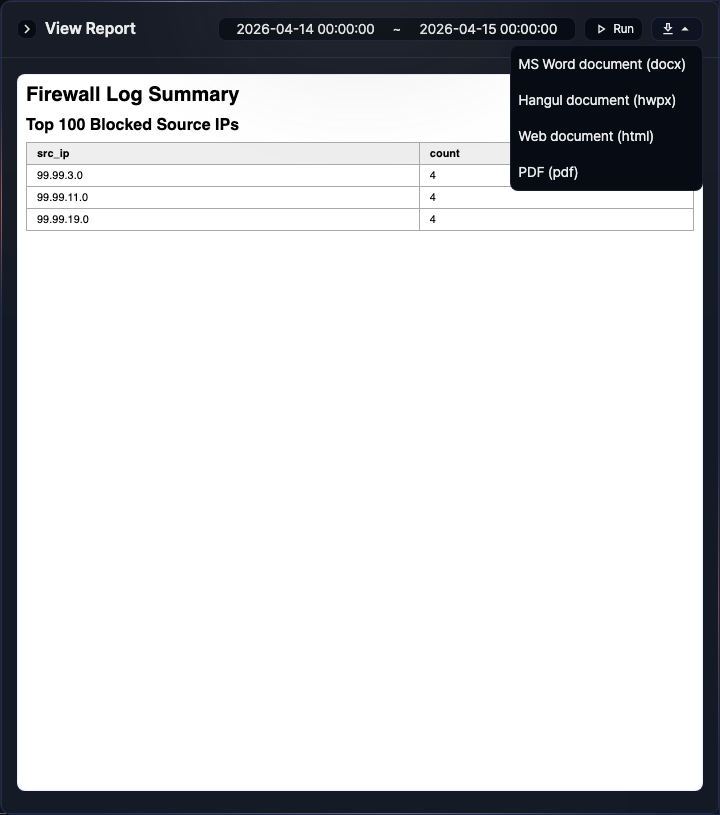
After the report is generated, click Download in the upper right corner and select your preferred format (Word document, HWP document, web document, or PDF) to download it to your local PC.
Generating and viewing query-based reports
You can also generate reports and receive them by email using the sonar-send-report command. Use scheduled queries to automate periodic report generation and delivery.
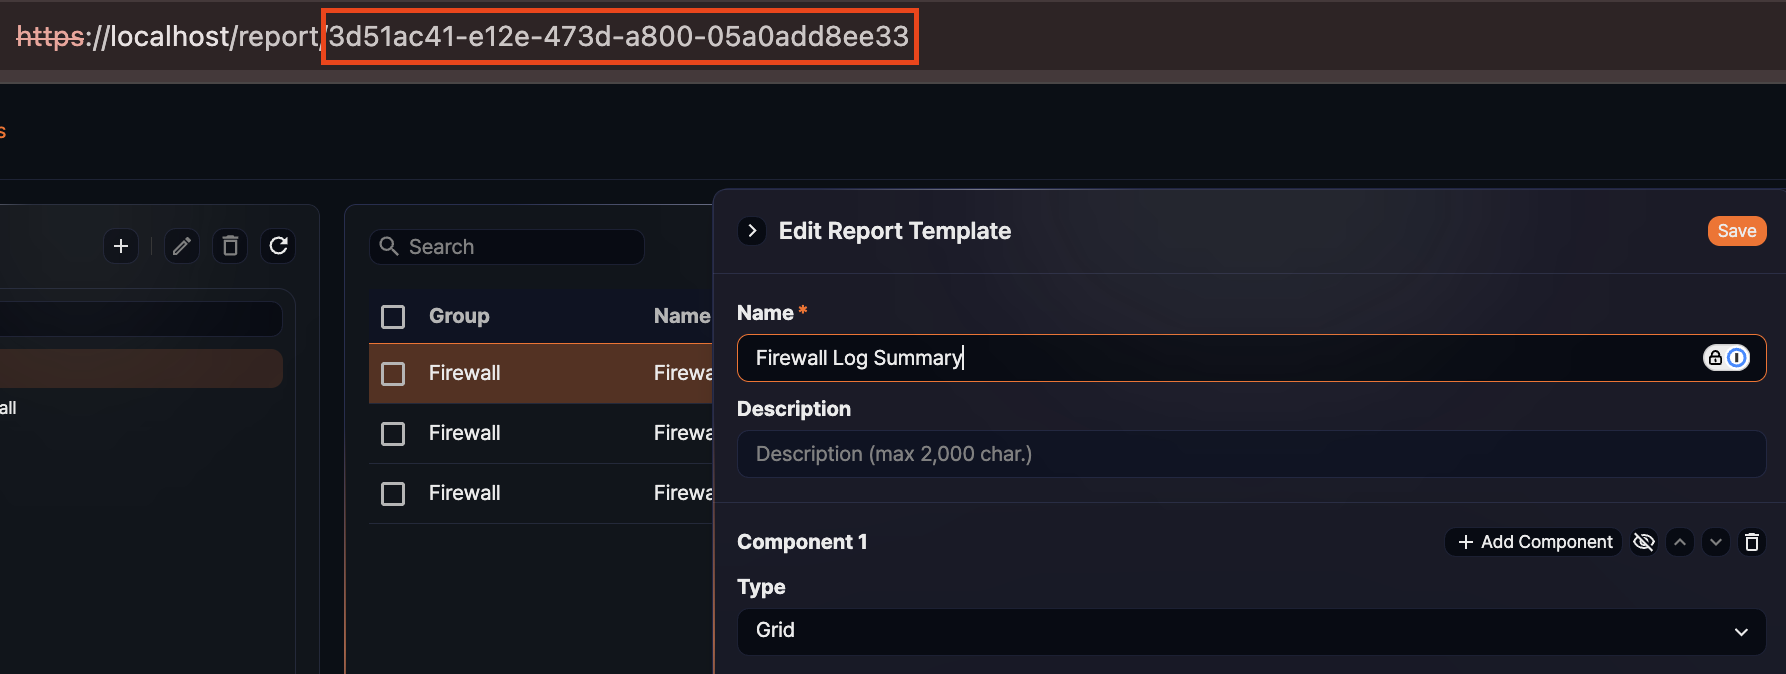
To use the sonar-send-report command, you must know the GUID of the report template. Click the Name of the report in the report template list and check your browser's address bar to find the GUID.
Delete report template
To delete a report template:
- Select the checkbox of the row for the report template you want to delete in the report template list.
- Click Delete in the toolbar.
- In the Delete Report Template dialog, confirm the details and click Delete. Click Cancel to cancel the operation.
Manage report groups
Report groups are used to organize and classify registered report templates.
Add report template group
To add a report template group:
-
Click
 above the report group list in Analysis > Reports.
 -
In the New Report Group dialog, enter the group details and click OK. Click Cancel to cancel the operation.

- Name (required): Name of the report template group (up to 50 characters)
- Description: Description of the report template group (up to 2,000 characters)
- Parent Group: If no parent group is specified, the new group is created at the top level.
Edit report template group
To modify a report template group:
- Click the report template group you want to modify in the report template group list under Analysis > Reports.
- Click
 above the report template group list.
 - In the Edit Report Group dialog, make the necessary changes and click OK. Click Cancel to discard changes.
Delete report template group
To delete a report template group:
- Click the report template group you want to delete in the report template group list under Analysis > Reports.
- Click
 above the report template group list.
 - In the Delete Report Group dialog, confirm the group details and click Delete. Click Cancel to cancel the operation.
- If you check Remove all subgroups., all subgroups are deleted. Report templates that belonged to those groups are moved to the parent group. Templates with no parent group are displayed as Uncategorized in the report template list.
- If you delete the group without checking Remove all subgroups., the subgroups and report templates in the deleted group are all moved to the parent group.
Move report template group
To move a report template to a different group:
- Select the checkbox of the row for the report template you want to move in the report template list.
- Click Move in the toolbar.
- In the Move Report Template dialog, select the destination group and click OK. Click Cancel to cancel the operation.