Logs
Overview
The Analysis > Logs menu is the main screen for reviewing data ingested by loggers. Because logger, logger model, and log schema settings are reflected directly in the search results, this page is useful when you need to compare raw records with normalized fields, validate ingestion quality, or inspect only the fields needed for analysis.
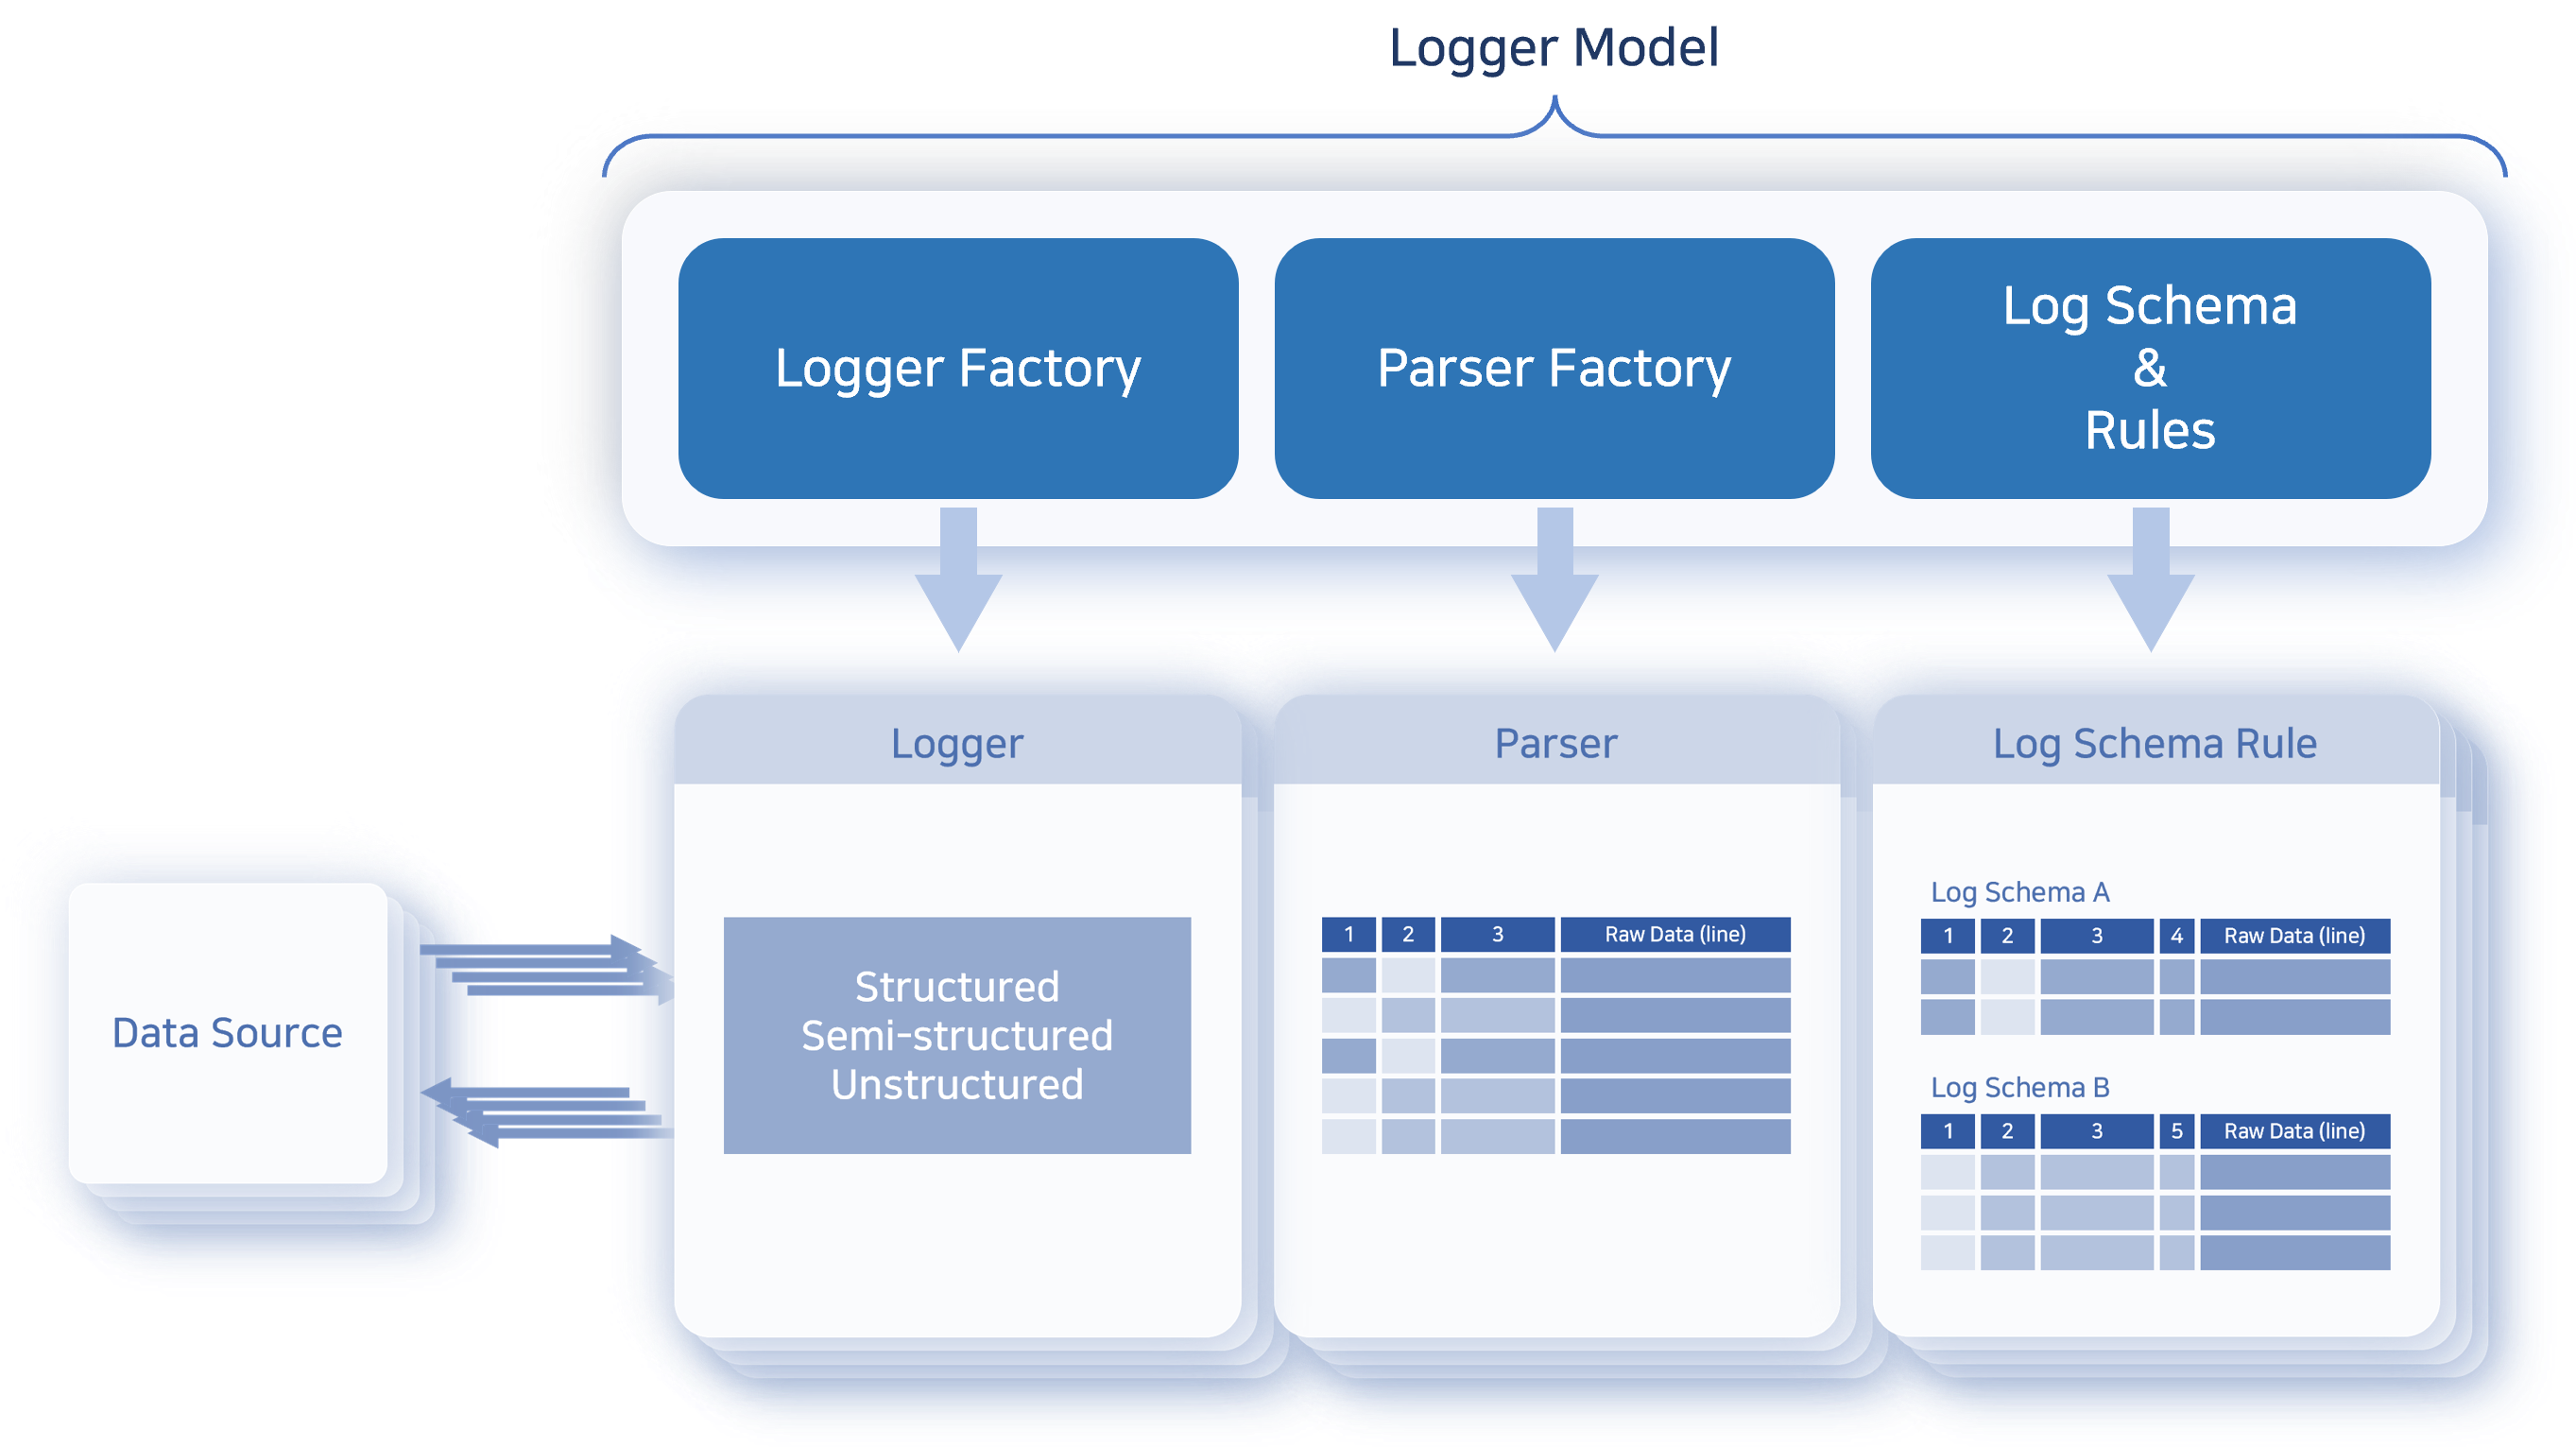
To understand log search properly, it helps to look at the ingestion path first. A logger model defines the parser, normalization rules, and schema mapping, while the logger uses that configuration to ingest raw data into a table. Because of that relationship, the Logs page lets you move between the raw form and the normalized form of the same data depending on the task at hand.
On this screen, you first choose which logger to query, then switch schemas if you need a normalized field set instead of raw records. After the query is complete, you can continue on the same page with follow-up actions such as adding filters, sorting fields, hiding columns, downloading results, or saving the query as a dataset.
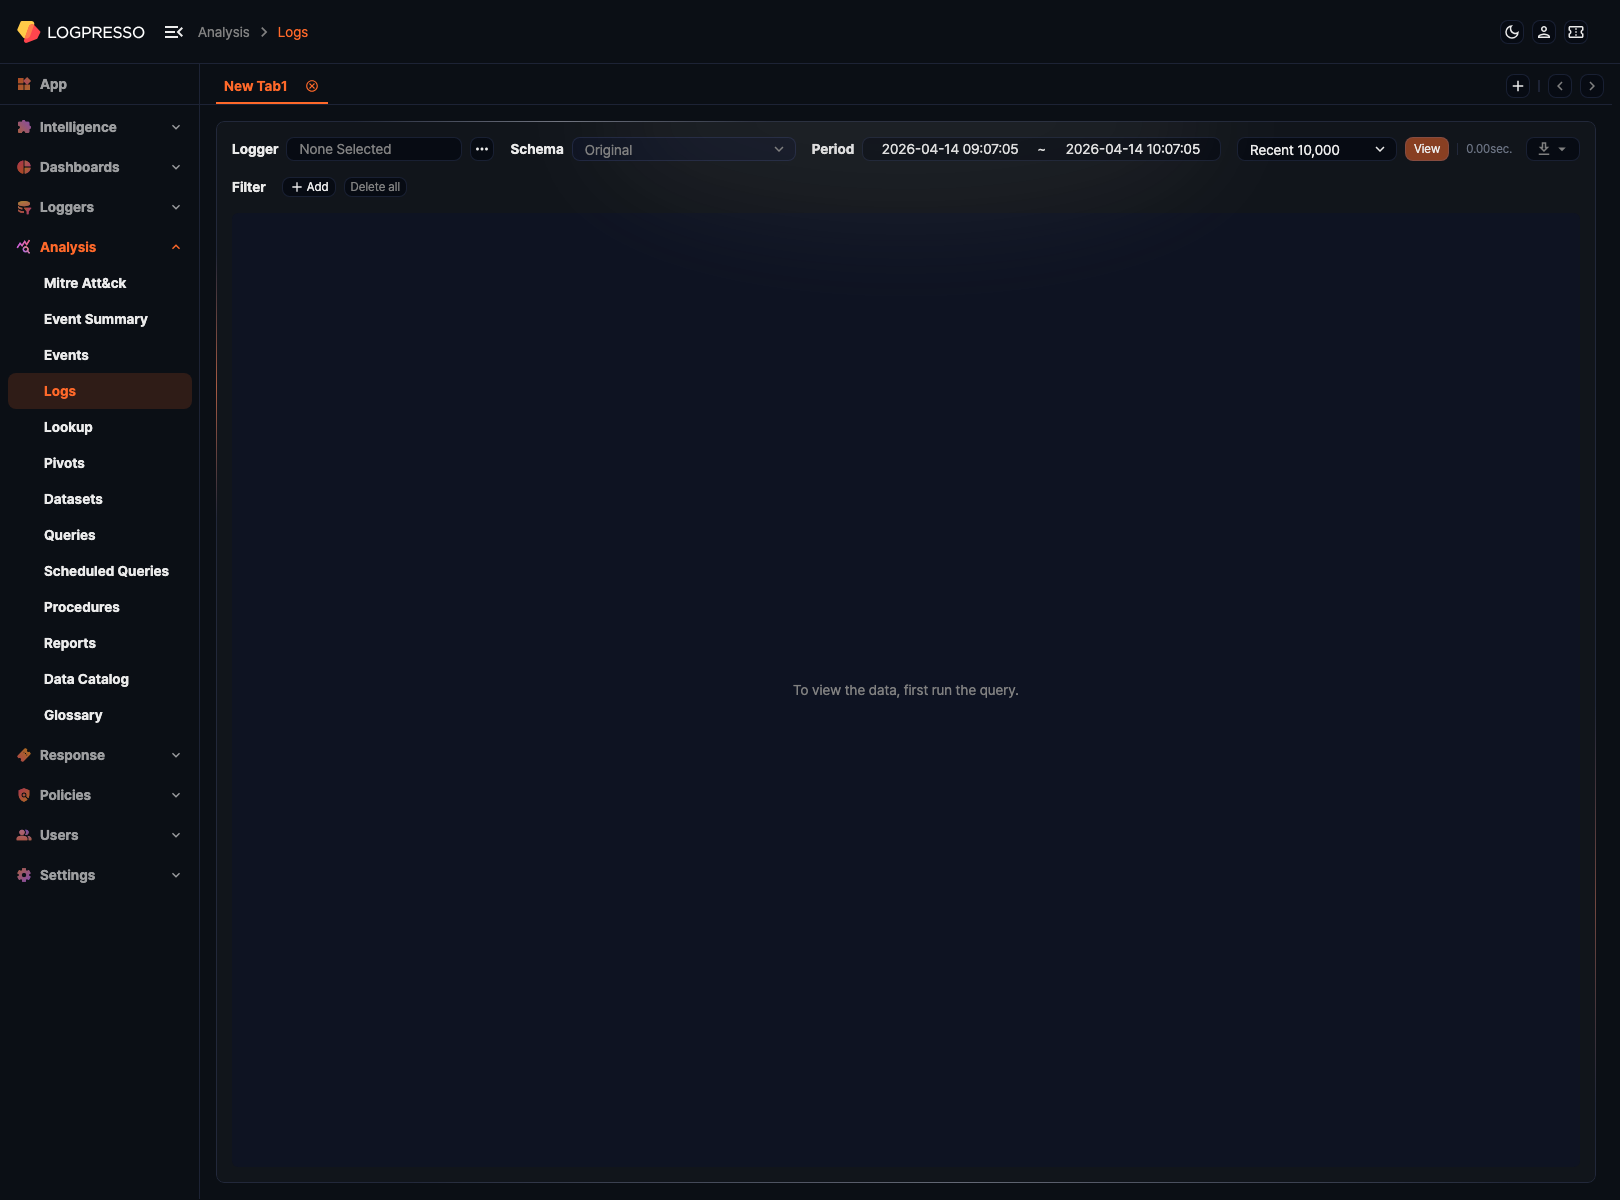
You must select at least one logger before you can run a query. When you first enter the page, the result area is empty. Click ![]() next to Logger to select a logger and proceed.
next to Logger to select a logger and proceed.
Query logs
- Go to Analysis > Logs.
- In the toolbar, specify the Logger, Schema, Time Range, and Maximum Records, then click Run.
- After the search results appear, continue with follow-up actions such as adding filters, sorting fields, hiding columns, saving, or downloading.
Toolbar
The toolbar at the top of the page contains the basic conditions that define the query target.
Logger
Selecting a logger is required before you can query logs. Click ![]() next to Logger to open the Logger Selection modal, check the target loggers, and click Select.
next to Logger to open the Logger Selection modal, check the target loggers, and click Select.
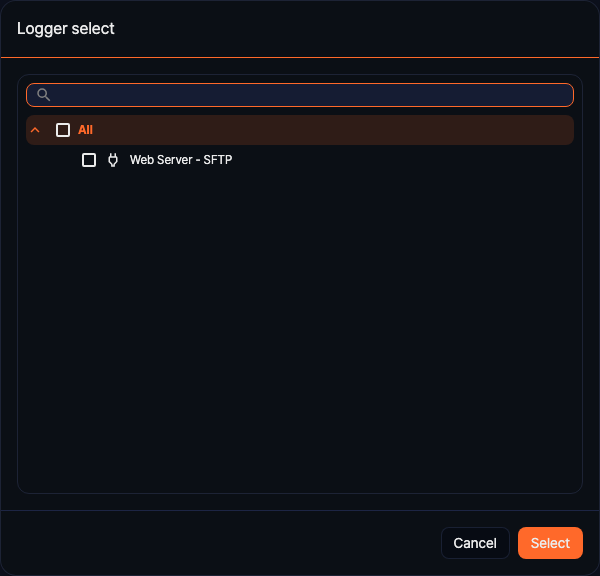
- You can select multiple loggers at once.
- When only one logger is selected, its name appears in the input field. When multiple loggers are selected, the field summarizes the number of selected items.
- Before a logger is selected, both Schema and Run remain disabled.
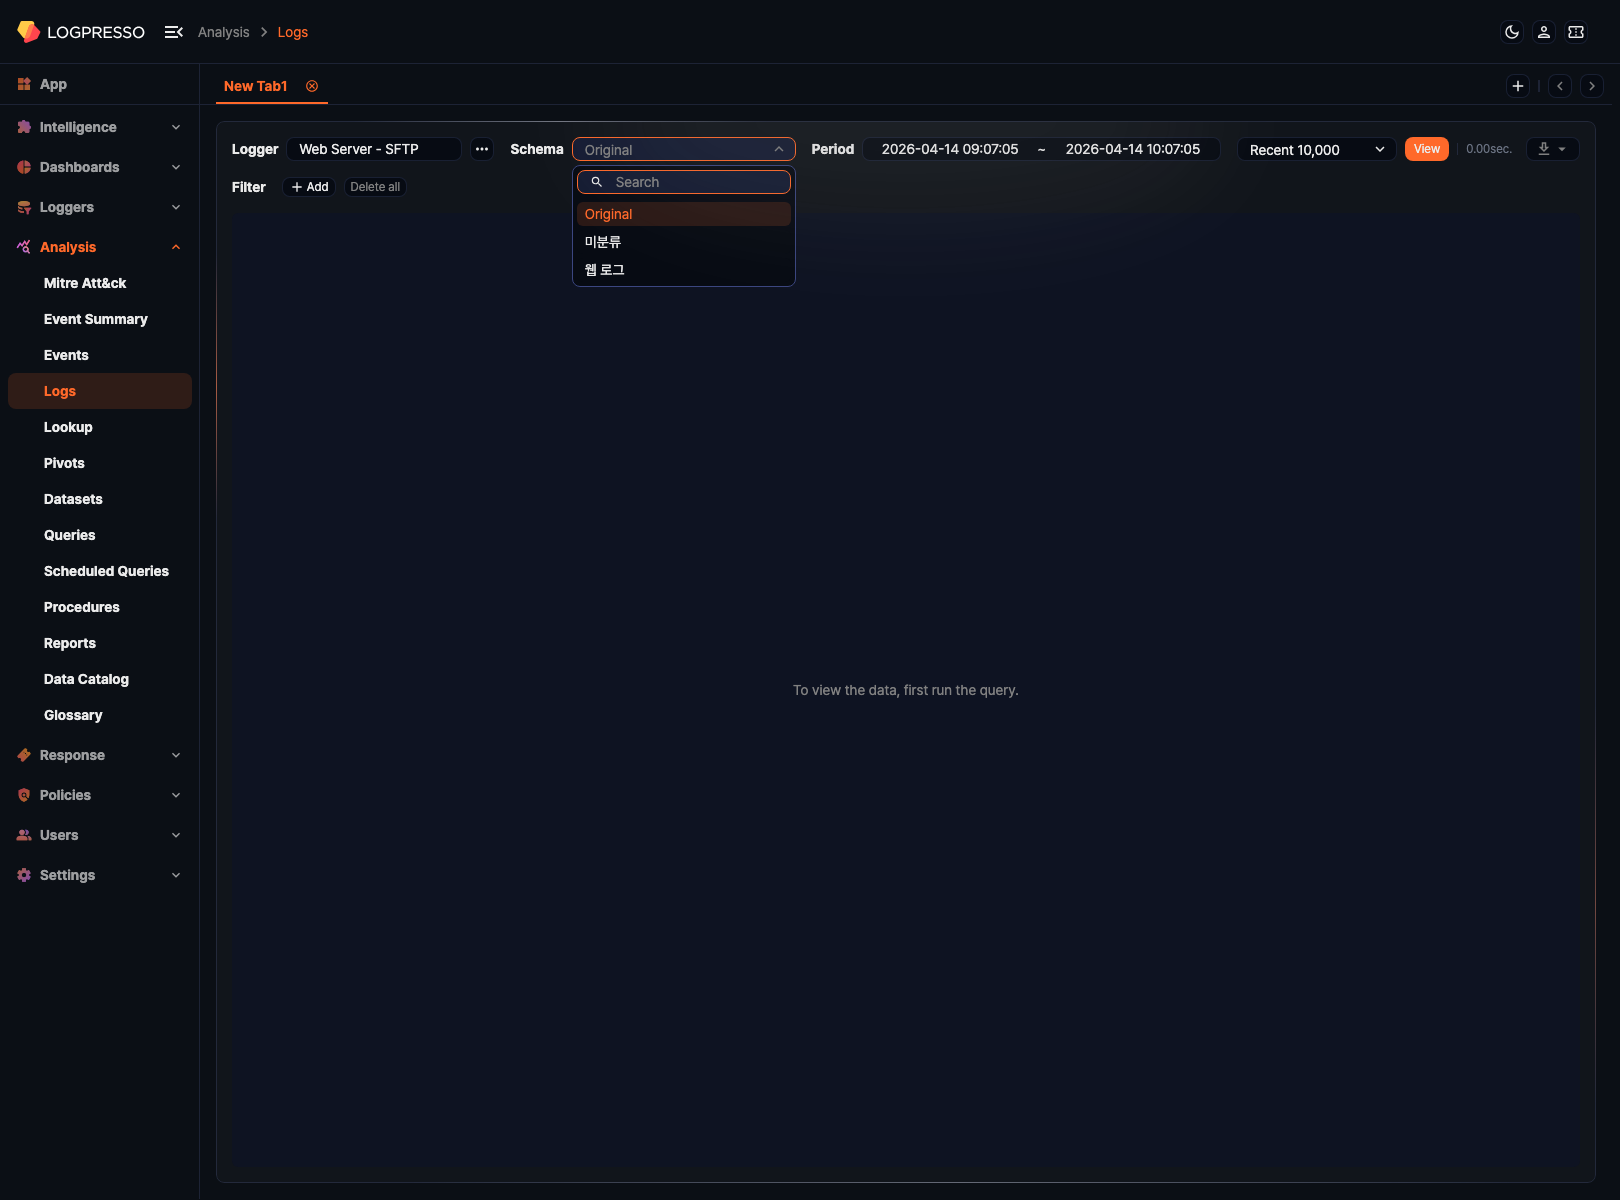
Schema
Use Schema to decide whether to view the raw records or a normalized field structure. If you do not select a schema, logs are displayed in raw form.
The schemas listed in the dropdown depend on the selected logger's logger model. Only log schemas referenced by the normalization models defined in the logger model appear in the list, so changing the logger also changes the available schemas.
- Raw
- The default state when no schema is selected. Displays the original records together with parser-extracted fields. Fields such as
_time,_logger,_schema, and the original message string are the most useful when checking ingestion immediately after collection. - Normalized schemas (e.g., Unknown, Web Log)
- Displays logs using the field structure defined by the logger model's normalization models. The column set changes when you switch schemas, even if the underlying data is the same.
Time range
Use Time Range to specify the query window down to the time level. The range picker lets you adjust both the start and end times.

- On first load, the page fills in the most recent one-hour range by default.
- Both a start time and an end time are required before the query can run.
Maximum records
Use Maximum Records to define how many records to load in a single query.
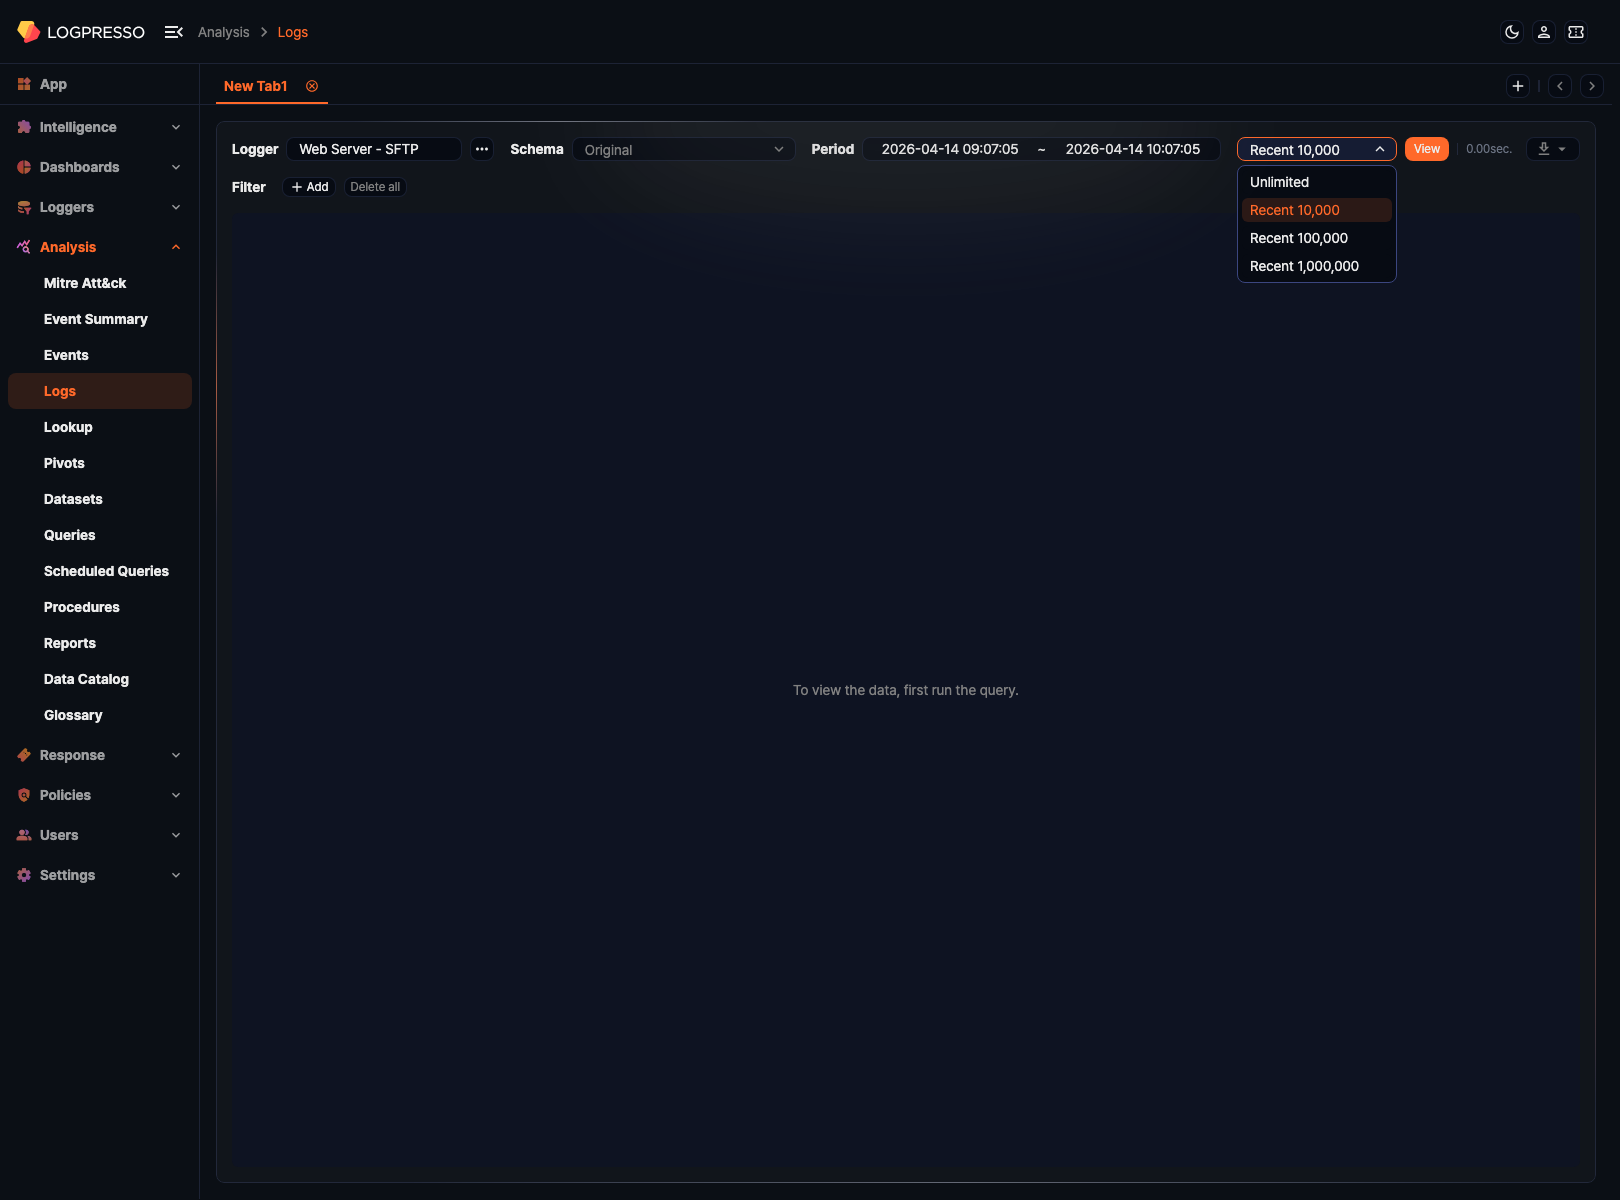
- The default value is 10,000 records.
- Depending on the environment, options such as Unlimited, 10,000, 100,000, and 1,000,000 may be available.
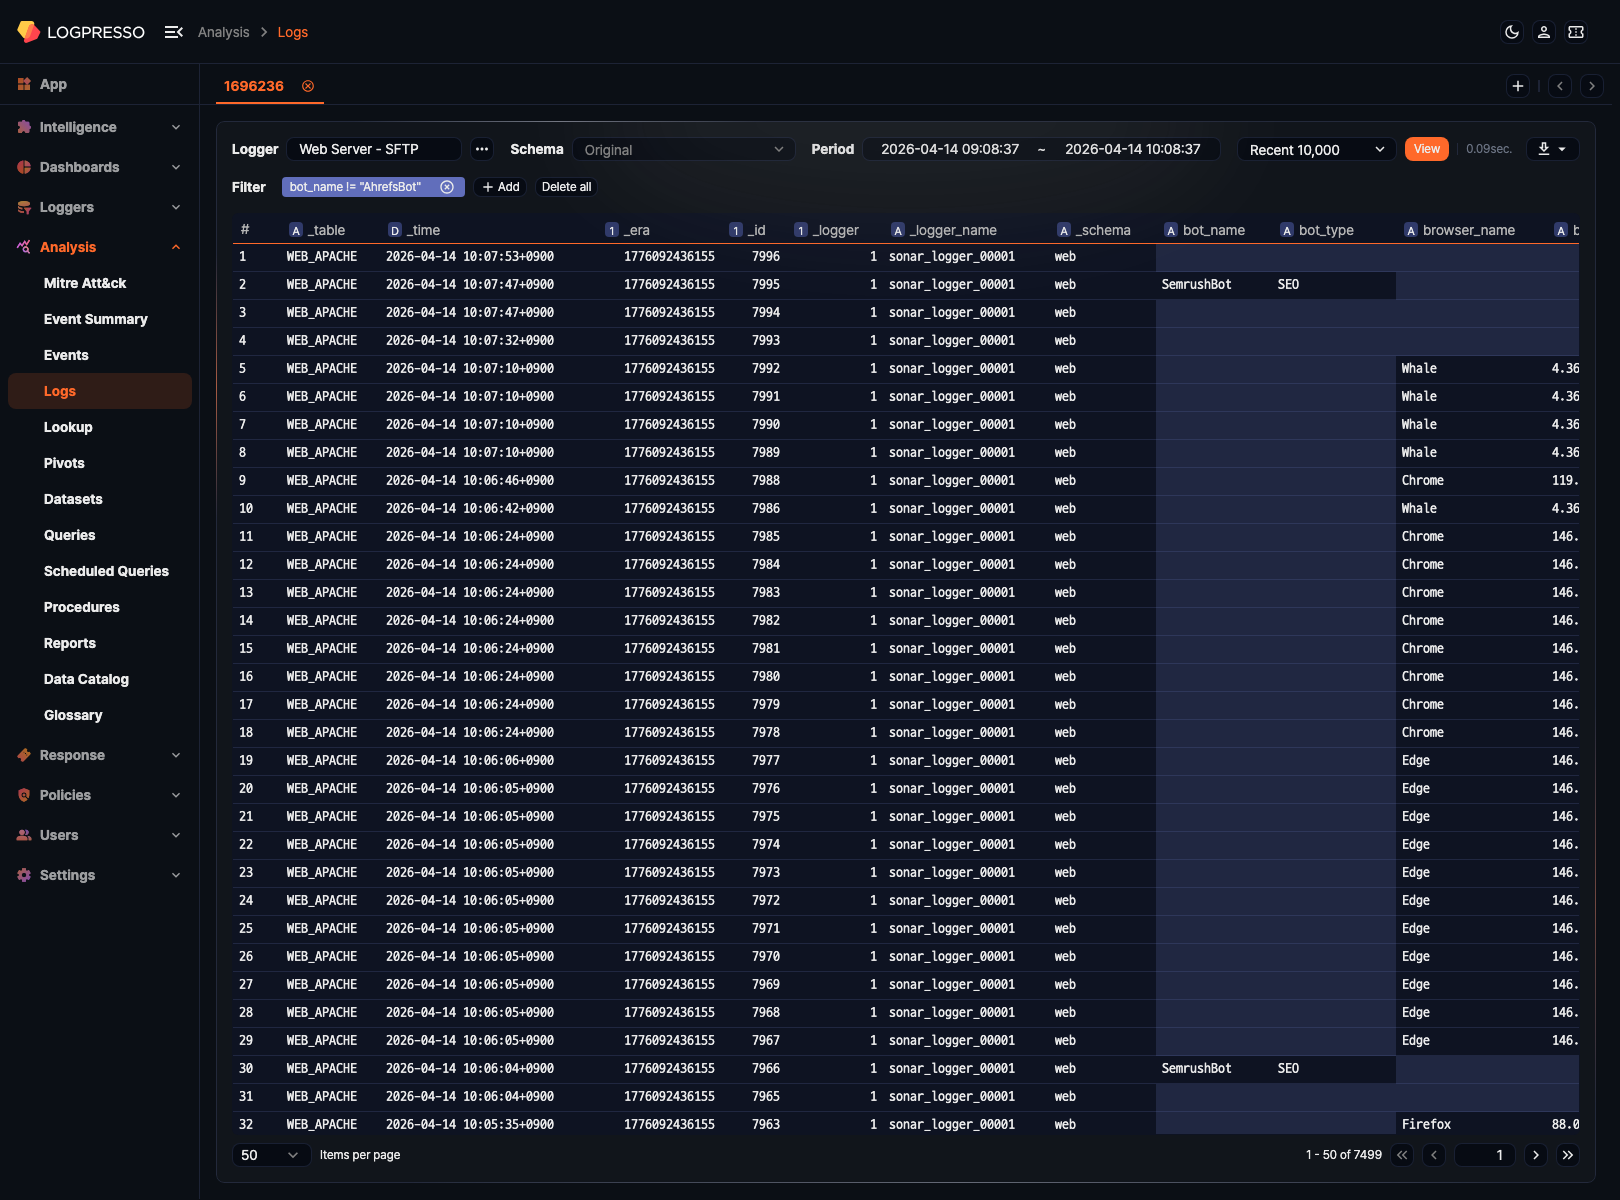
Query results
After you specify a logger and the query conditions, click Run to load results into the grid below. The table is paginated by default, and you can move between pages or change the page size from the controls in the lower-right area of the grid.
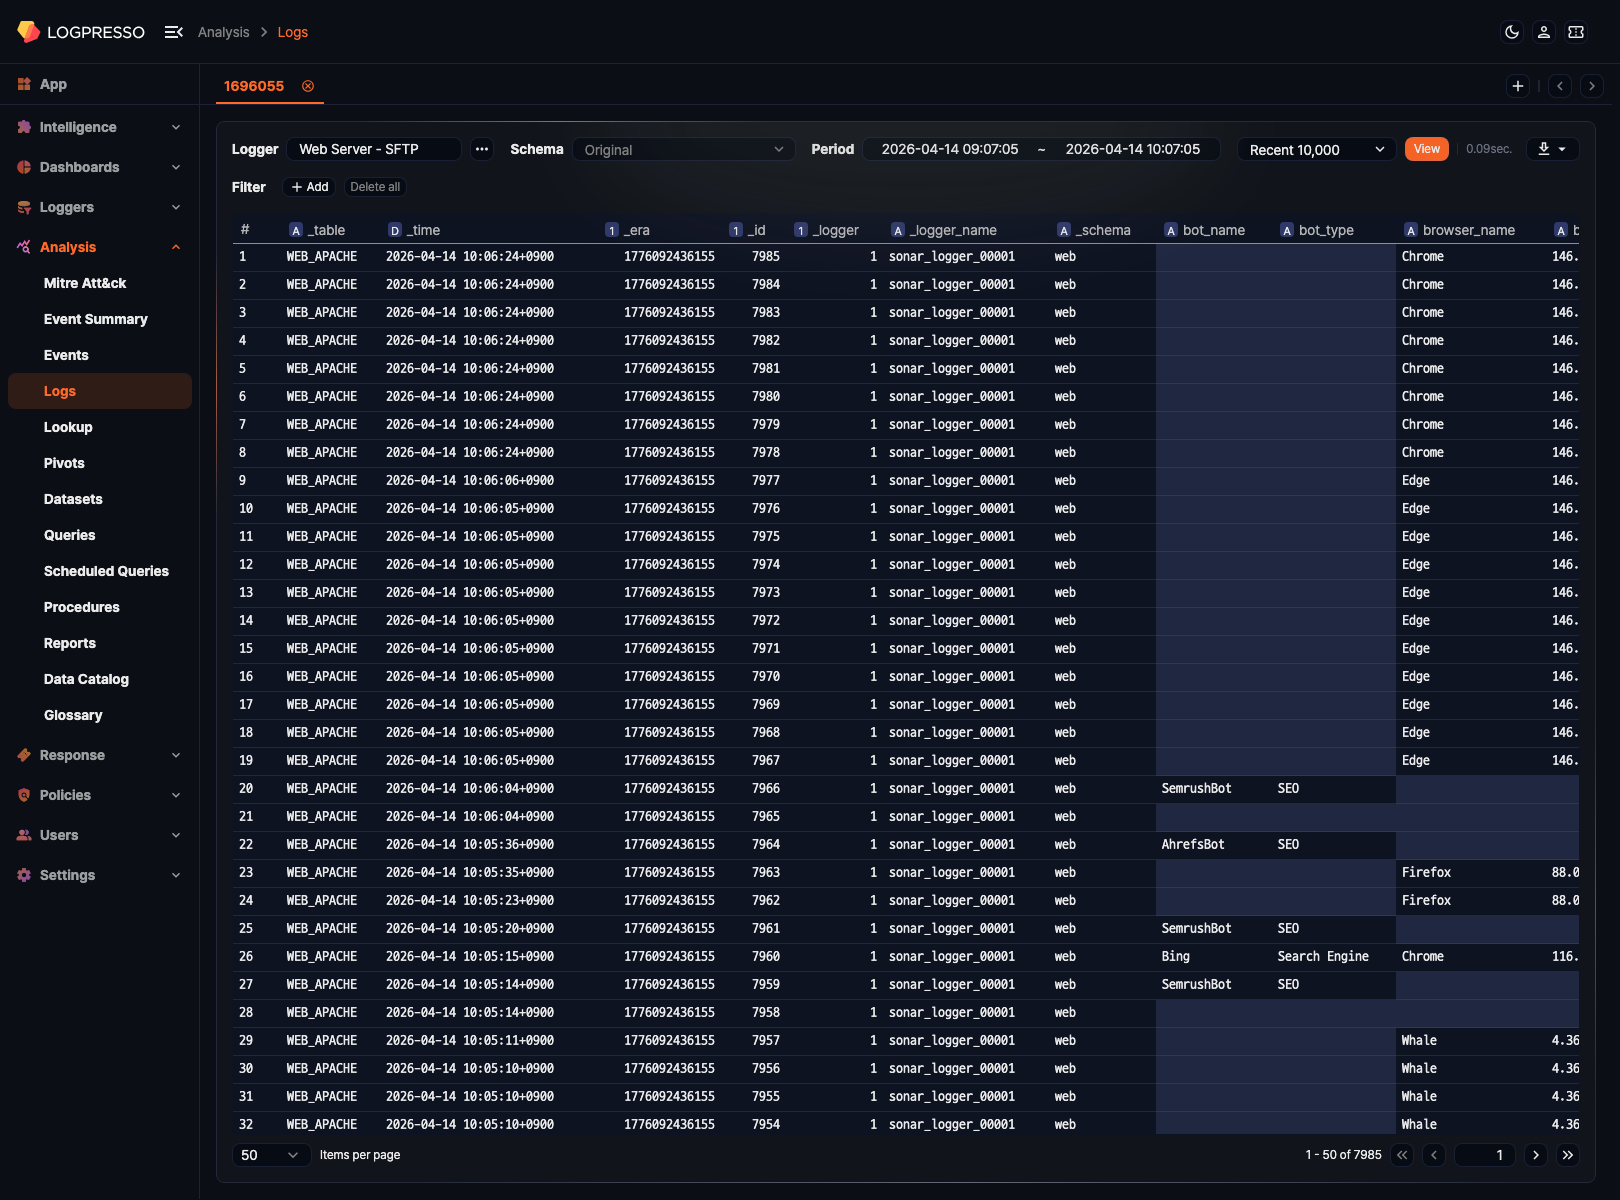
- In the raw schema view, you can inspect metadata and parser-extracted fields such as
_table,_time,_logger_name, and_schema. - The bottom area of the grid shows the total number of records and the current page range.
- After the query completes, the elapsed search time appears to the right of the Run button.
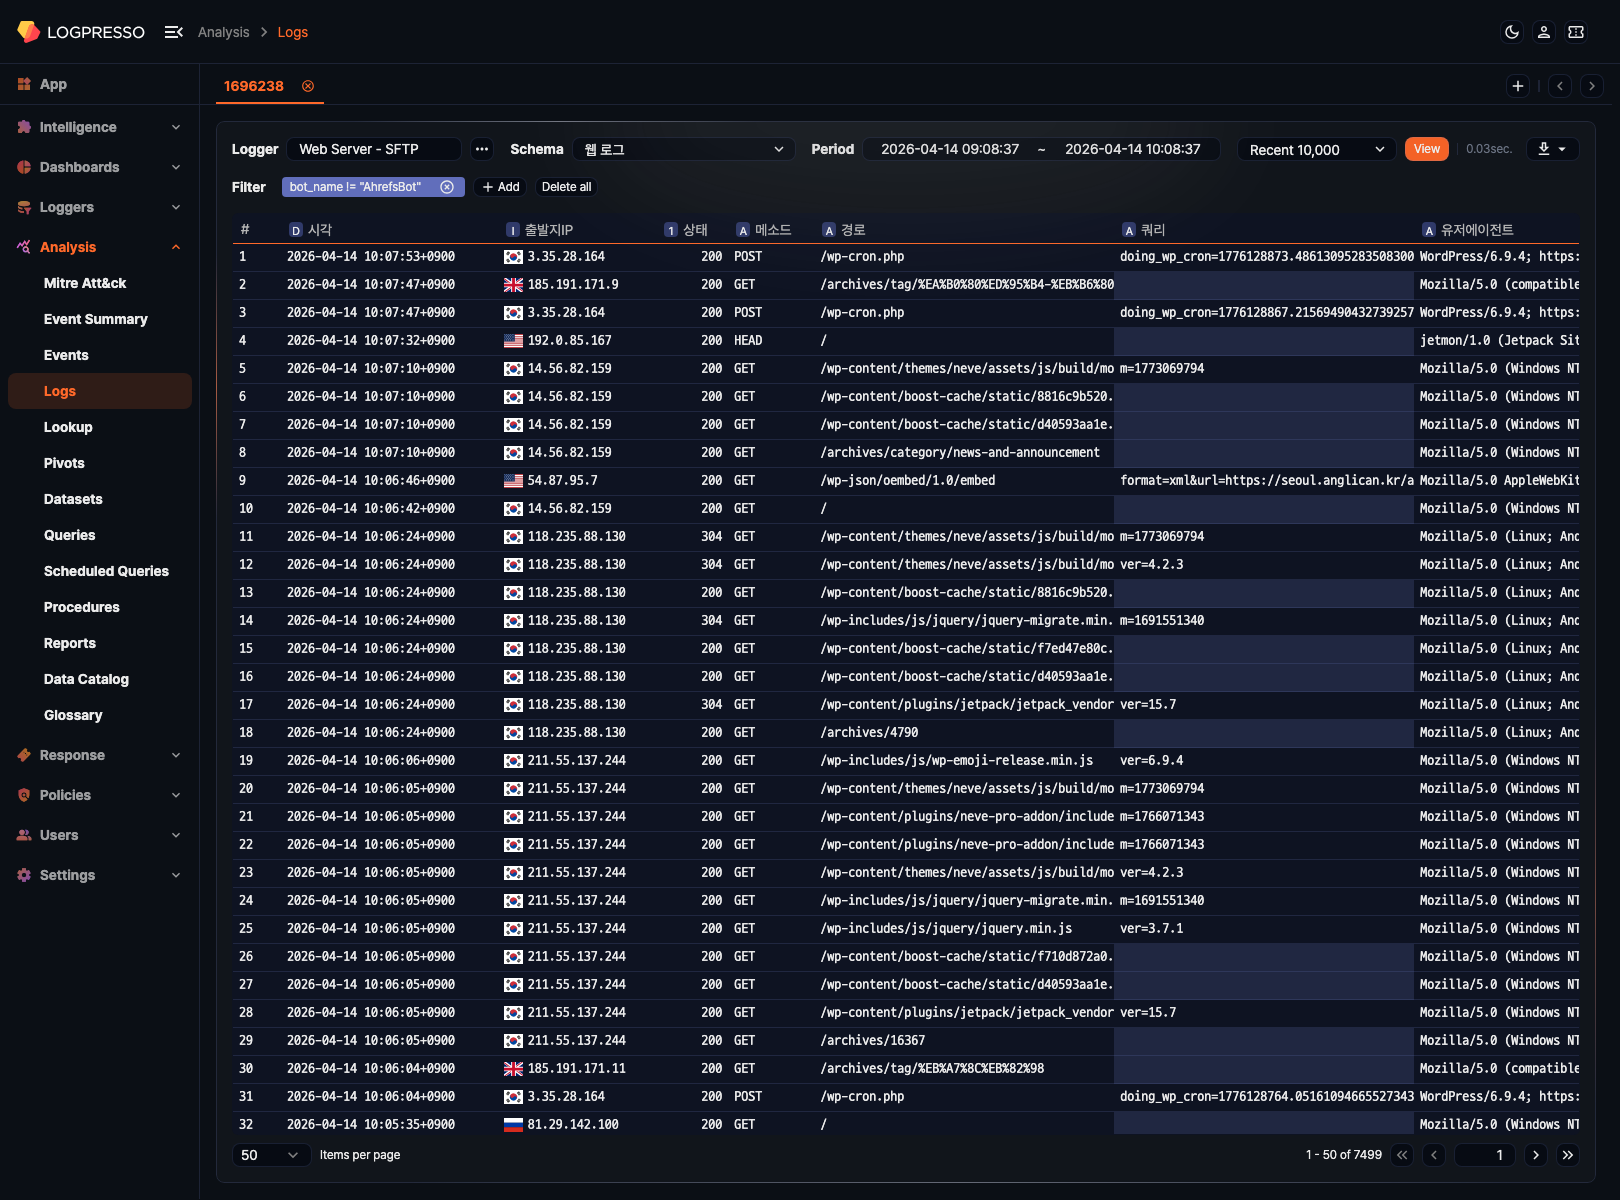
If you switch to a normalized schema such as Web Log, the result columns change accordingly.
Filters
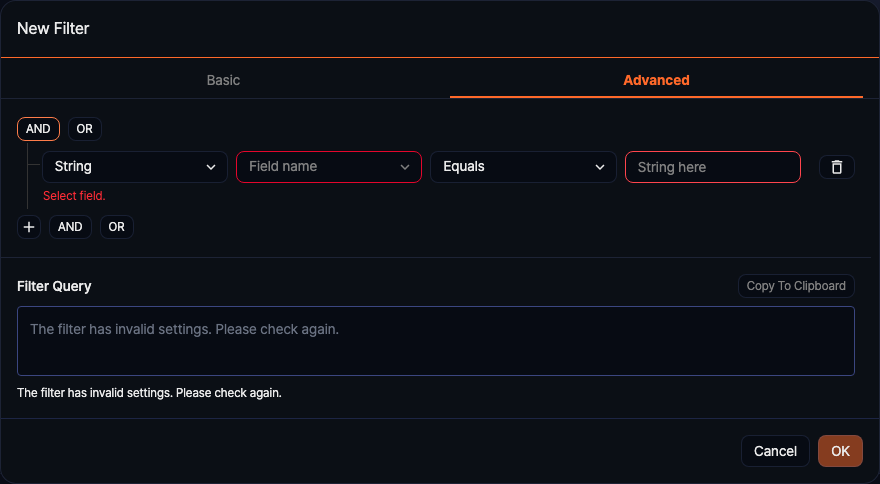
Use filters to narrow down the current result set without running the query again. Click Add in the Filter area above the grid to open the filter modal.
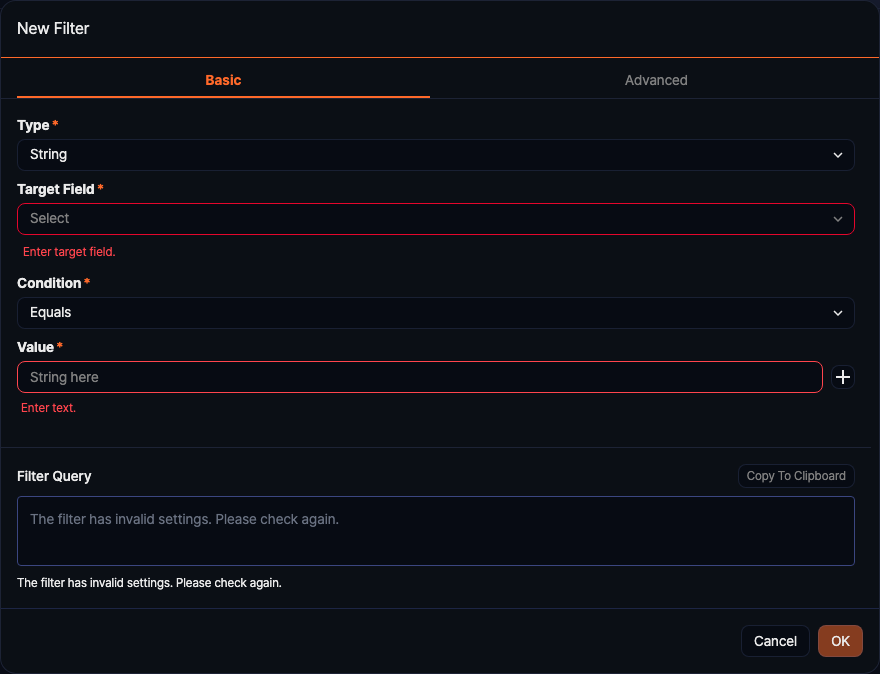
- Type: Defines the comparison model, such as string, integer, date, IP address, or expression.
- Target Field: Selects one of the fields currently available in the query result.
- Condition: Provides comparison operators appropriate for the selected type.
- Value: Defines the comparison value.
- Filter Query: Shows how the selected condition is converted into a query expression.
If you need more complex logic, switch to the Advanced tab and combine conditions with AND or OR.
After a filter is applied, the condition appears as a chip in the filter area above the result grid.
Field sorting and display management
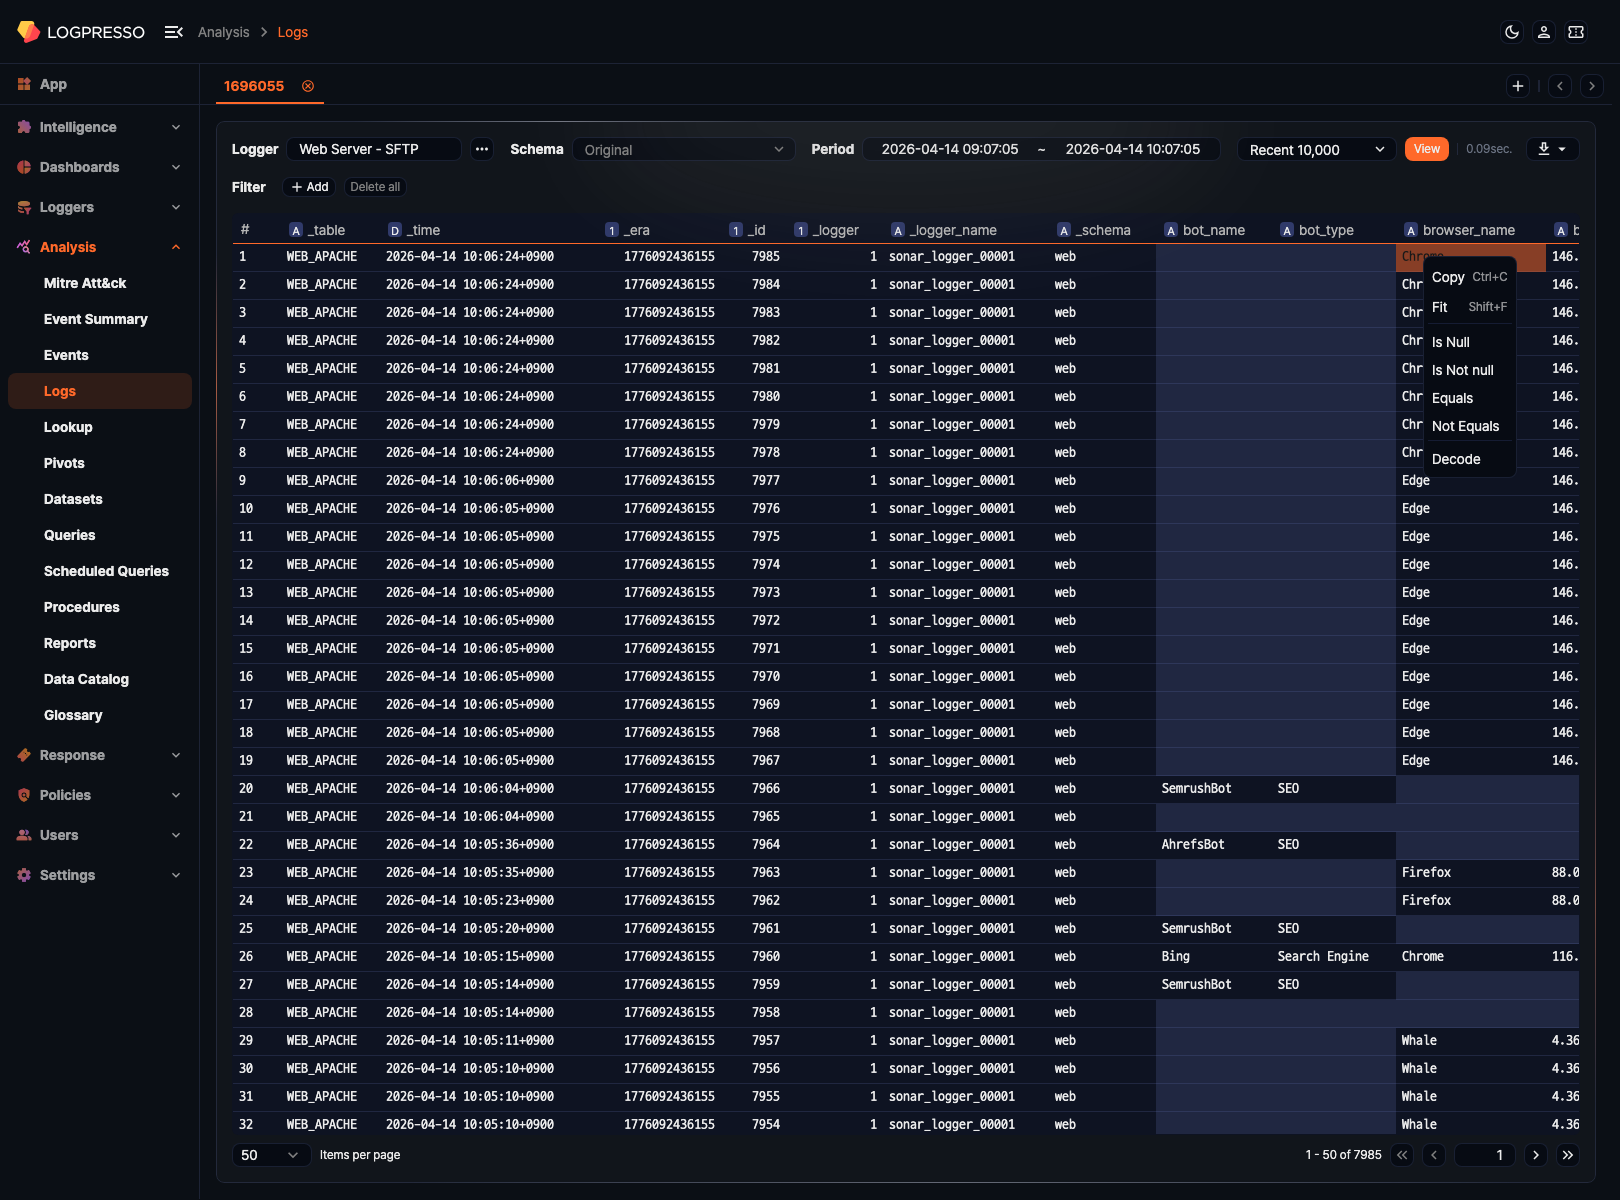
Right-click a cell in the result table to open a popup menu. From the popup menu, you can sort, hide fields, or copy values.
Tabs
The Logs page supports multiple tabs so you can compare different searches side by side. Use the plus button in the upper-right area to open a new tab, and close tabs you no longer need.

Save and download results
After a query finishes, use the download menu on the right side of the toolbar to choose how to reuse the result.
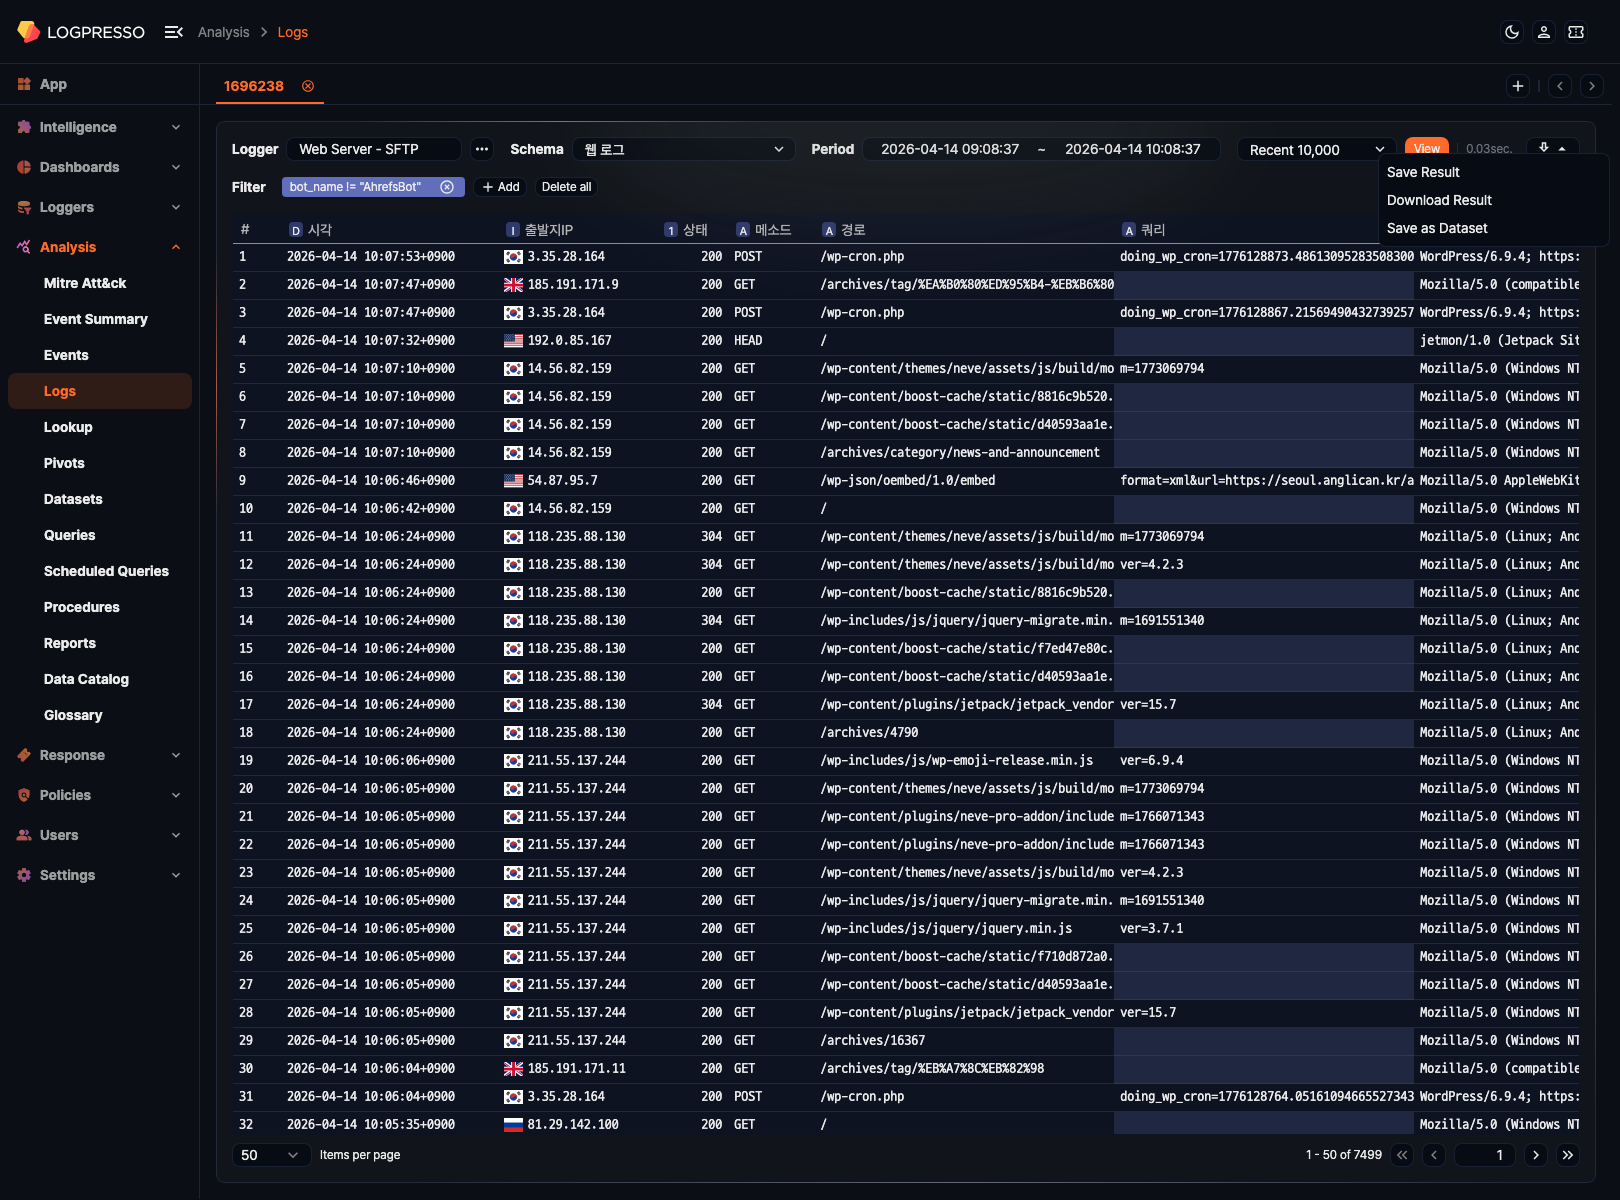
Save as dataset
Use Save Dataset when you want to rerun the same search conditions later to collect data again.
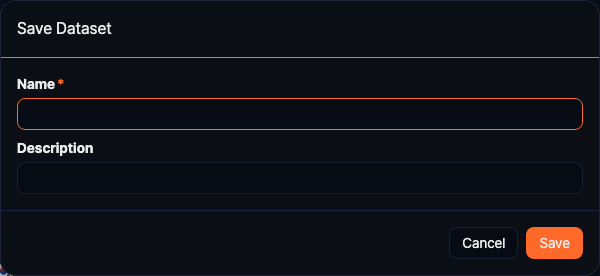
- Saved datasets can be reviewed later in the Dataset menu.
- You can use saved datasets as the basis for follow-up work in Pivot or Query.
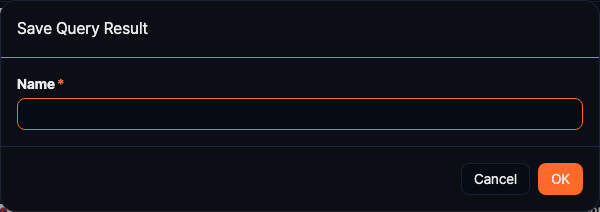
Save query result
Use Save Query Result when you want to preserve the current result exactly as it is at this point in time.
Download query result
Use Download Query Result when you want to export the search result to a file.
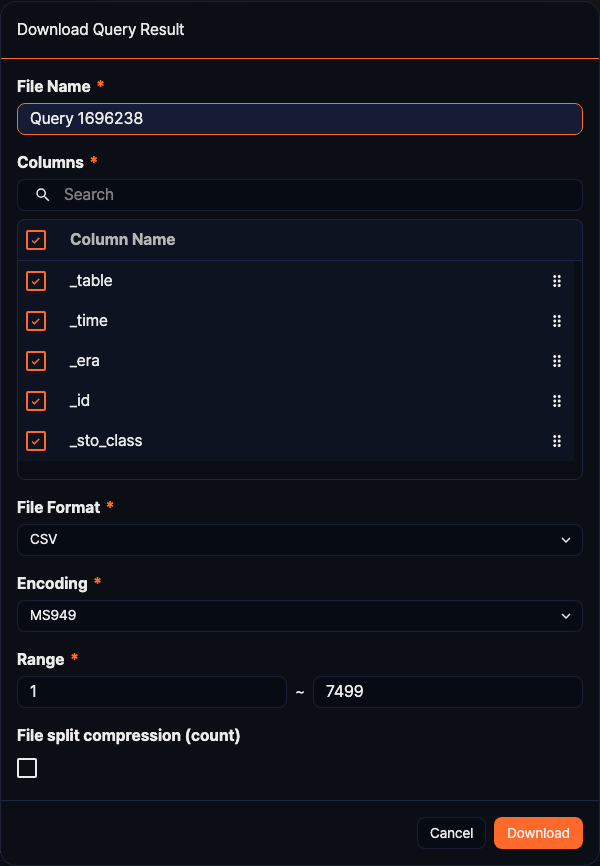
- File Name: Defines the name of the exported file.
- Columns: Selects which fields to include in the exported file.
- File Format: Chooses an output format such as CSV, JSON, or PDF.
- File Encoding: Selects the text encoding.
- Range: Defines how many log records to export.