Query Monitor
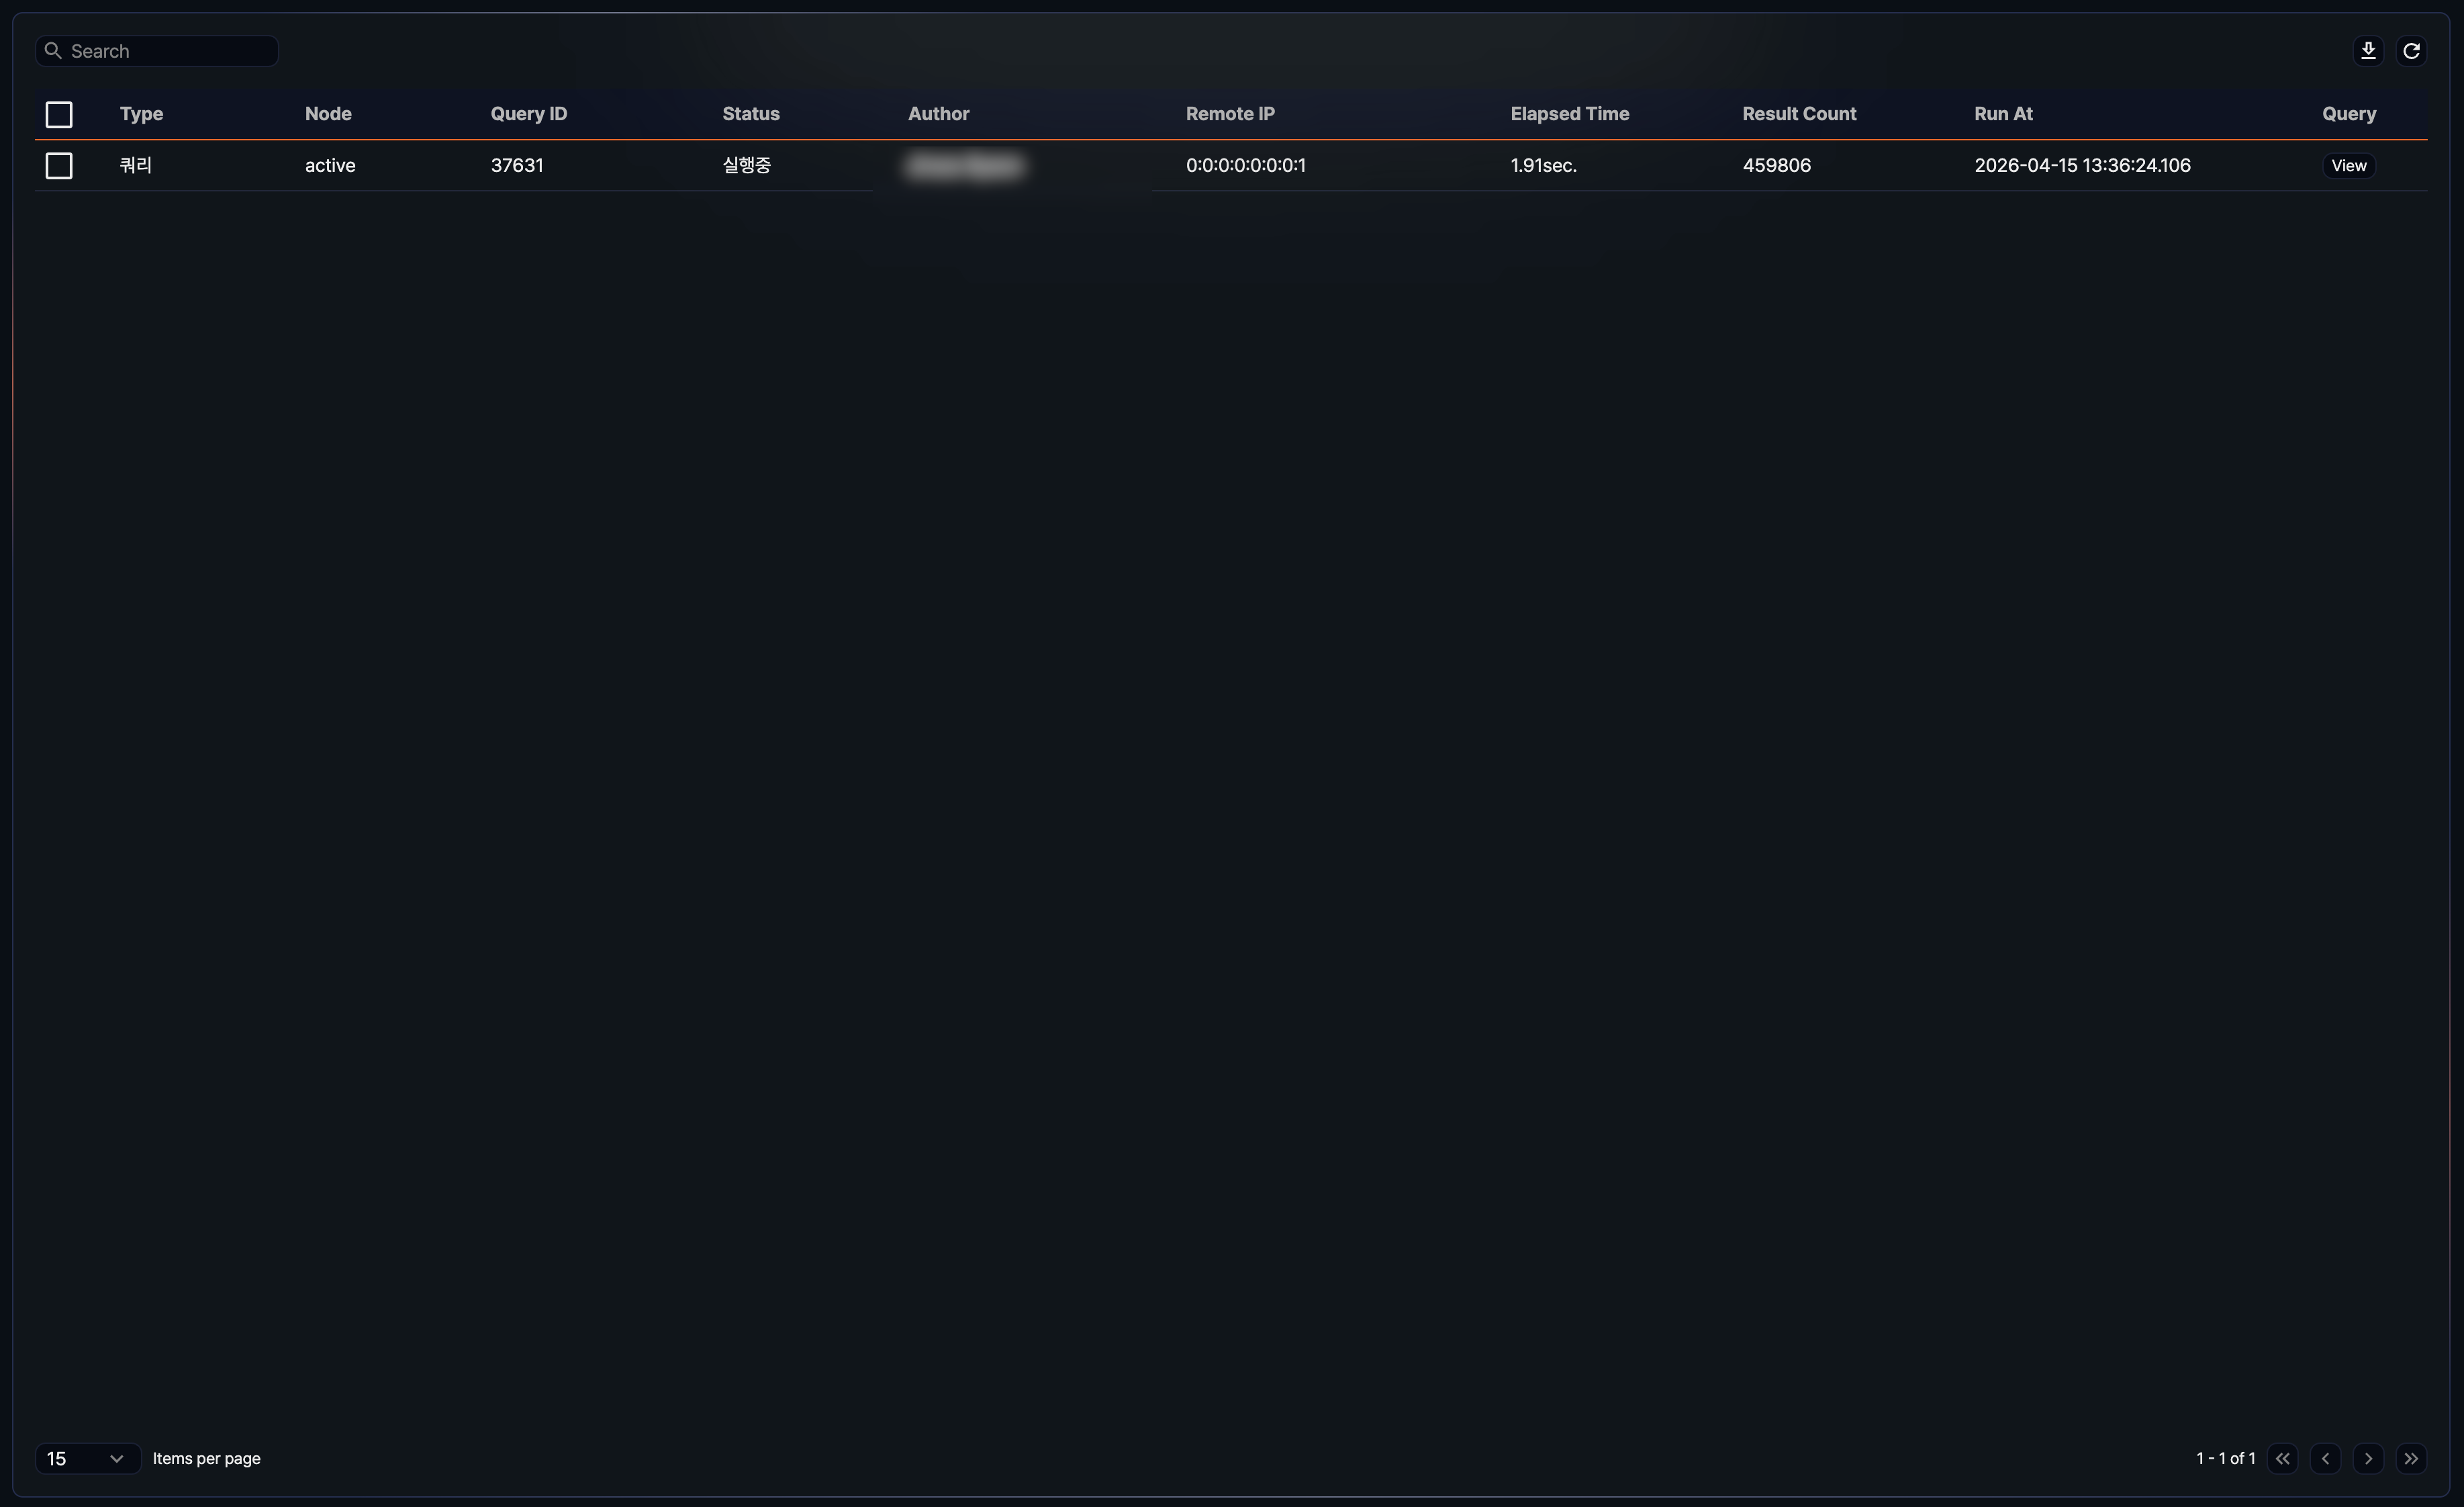
Use the Query Monitor to view a real-time list of queries currently running in Logpresso Sonar.
- Type: Type of query
- Node: Node on which the query is running
- Query ID: Unique identifier for the query
- Status: Current execution status of the query (for example, running or completed)
- Author: User account that initiated the query
- Remote IP: Client IP address from which the query was executed
- Elapsed Time: Time elapsed since the query started
- Result Count: Number of records returned by the query
- Run At: Date and time the query started
- Query: Button to view the query statement
Running queries
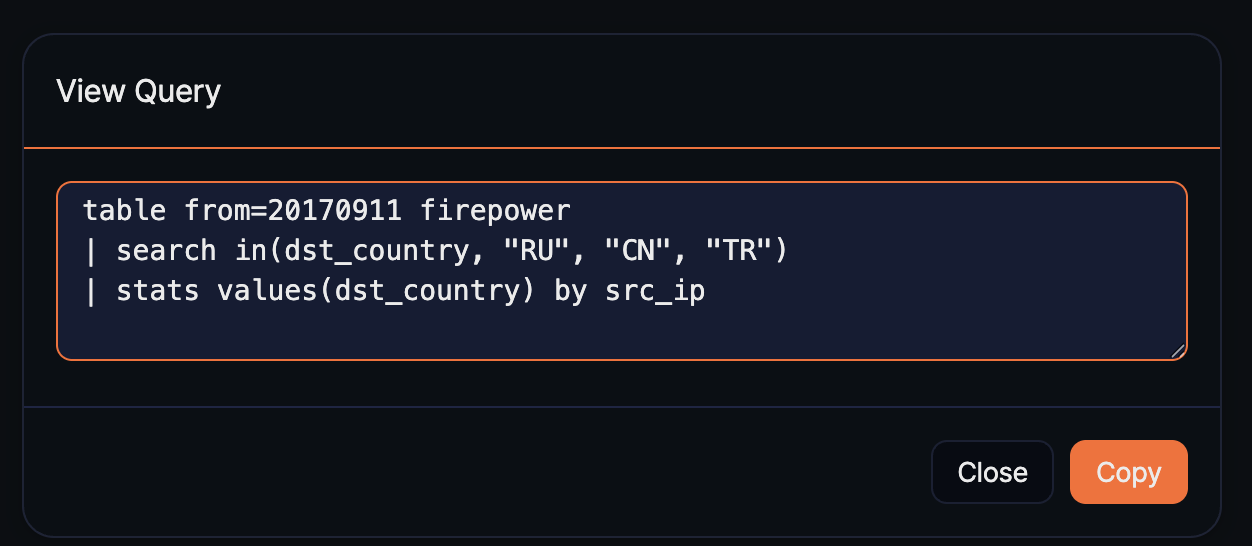
To view a query statement, click the View button to the right of the query entry. The Query View dialog shows the full query text.
- Click Copy to clipboard to copy the query content.
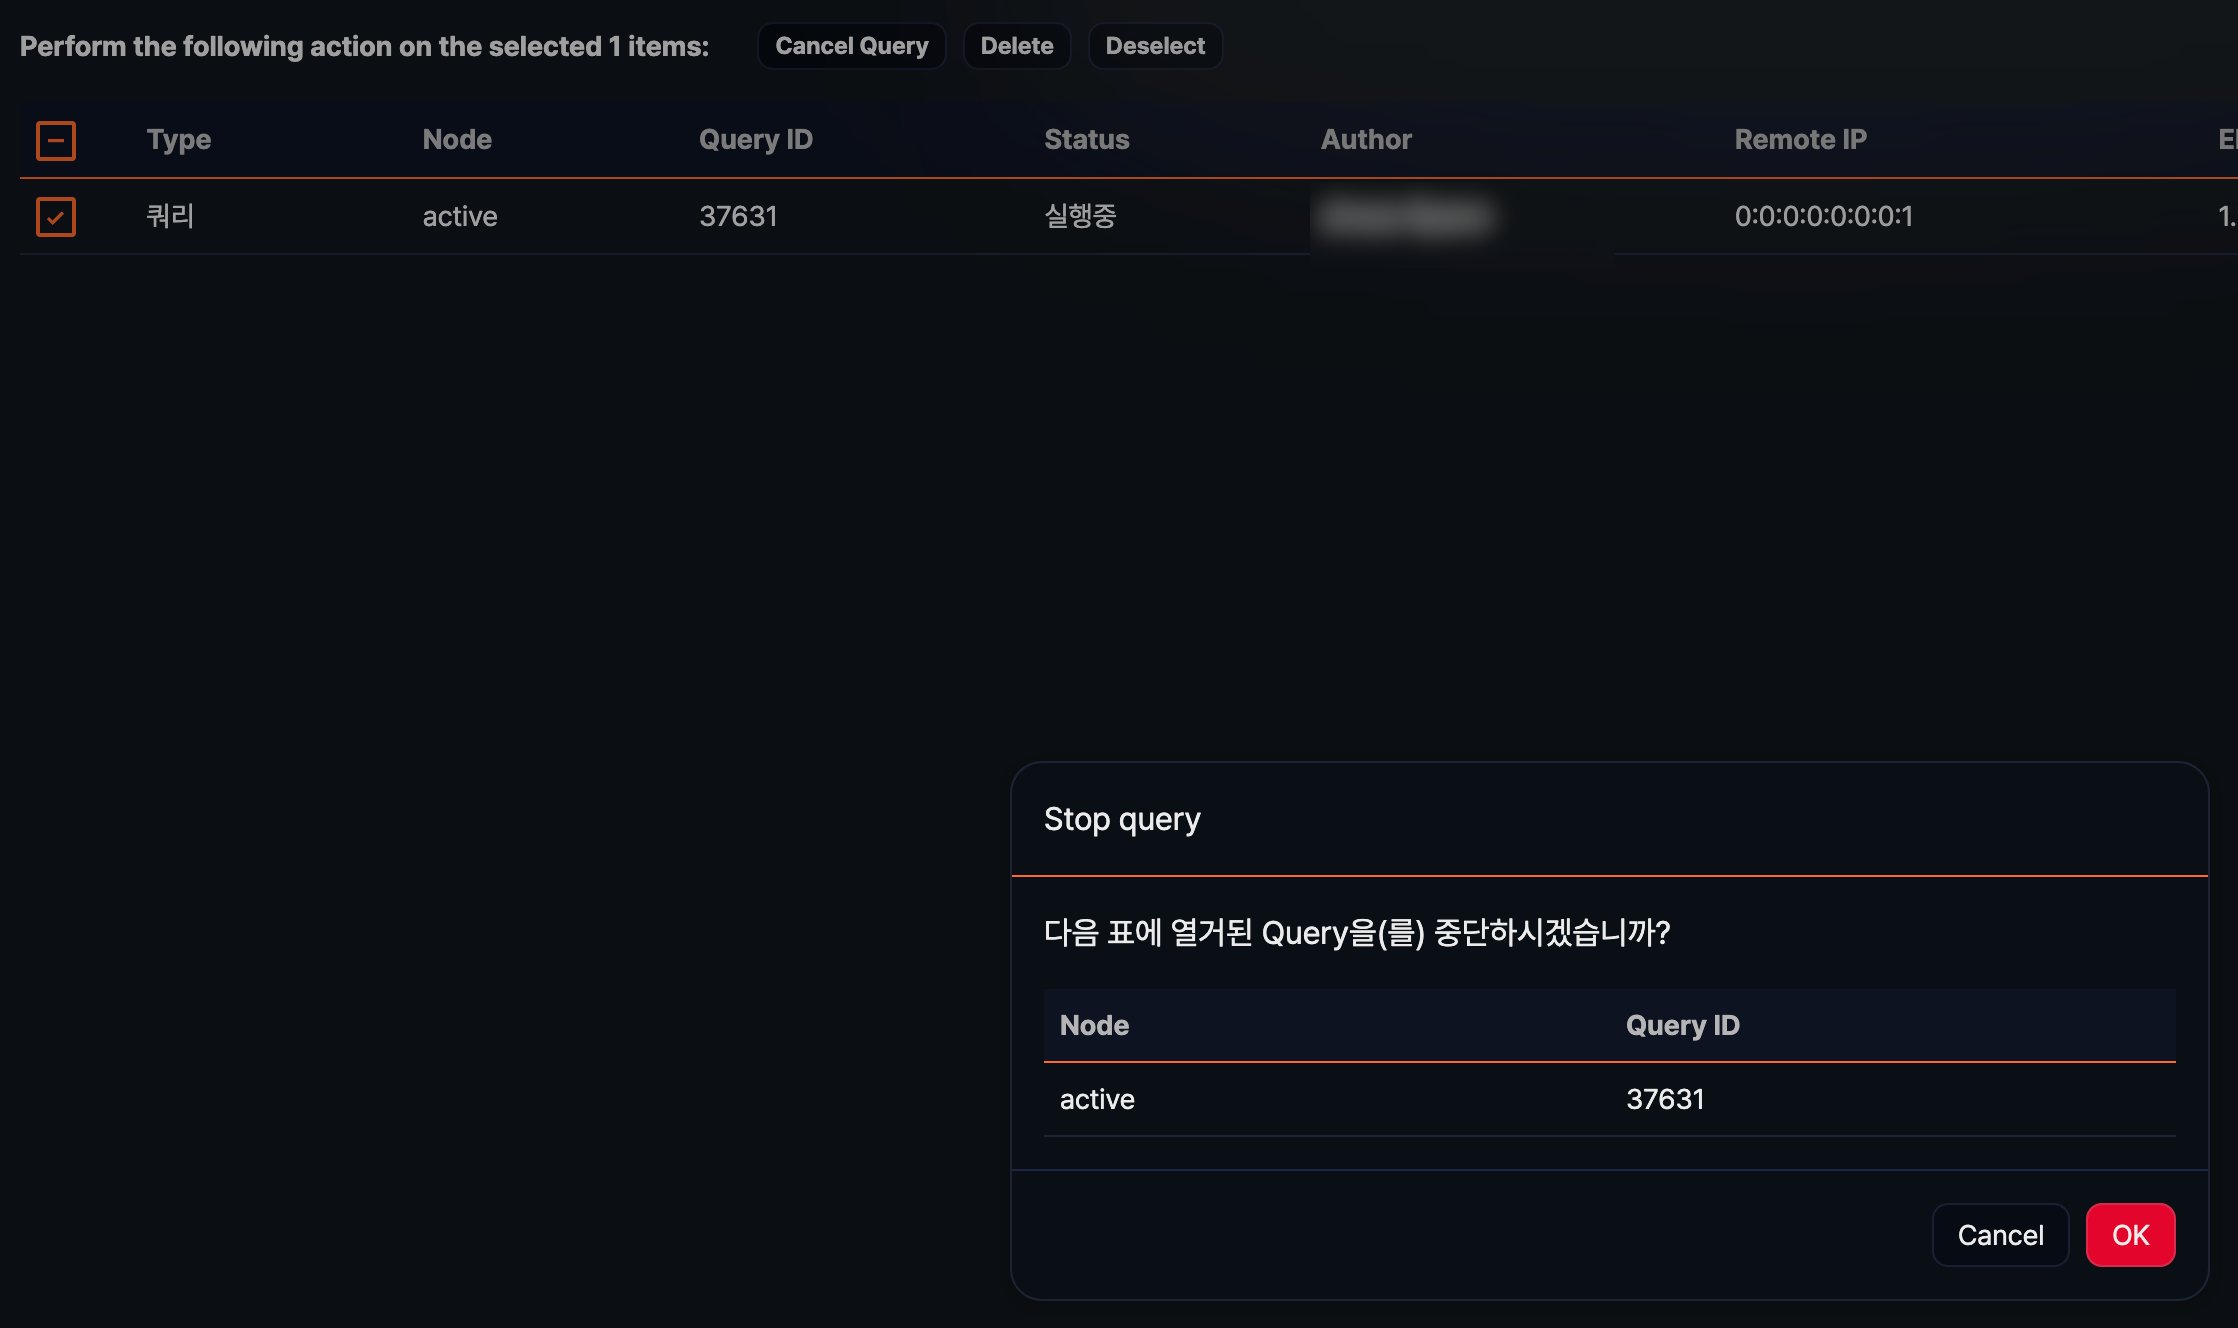
Cancel query
Select one or more queries and click Cancel Query to stop execution immediately.